Open Access
Fig. 14.
Download original image
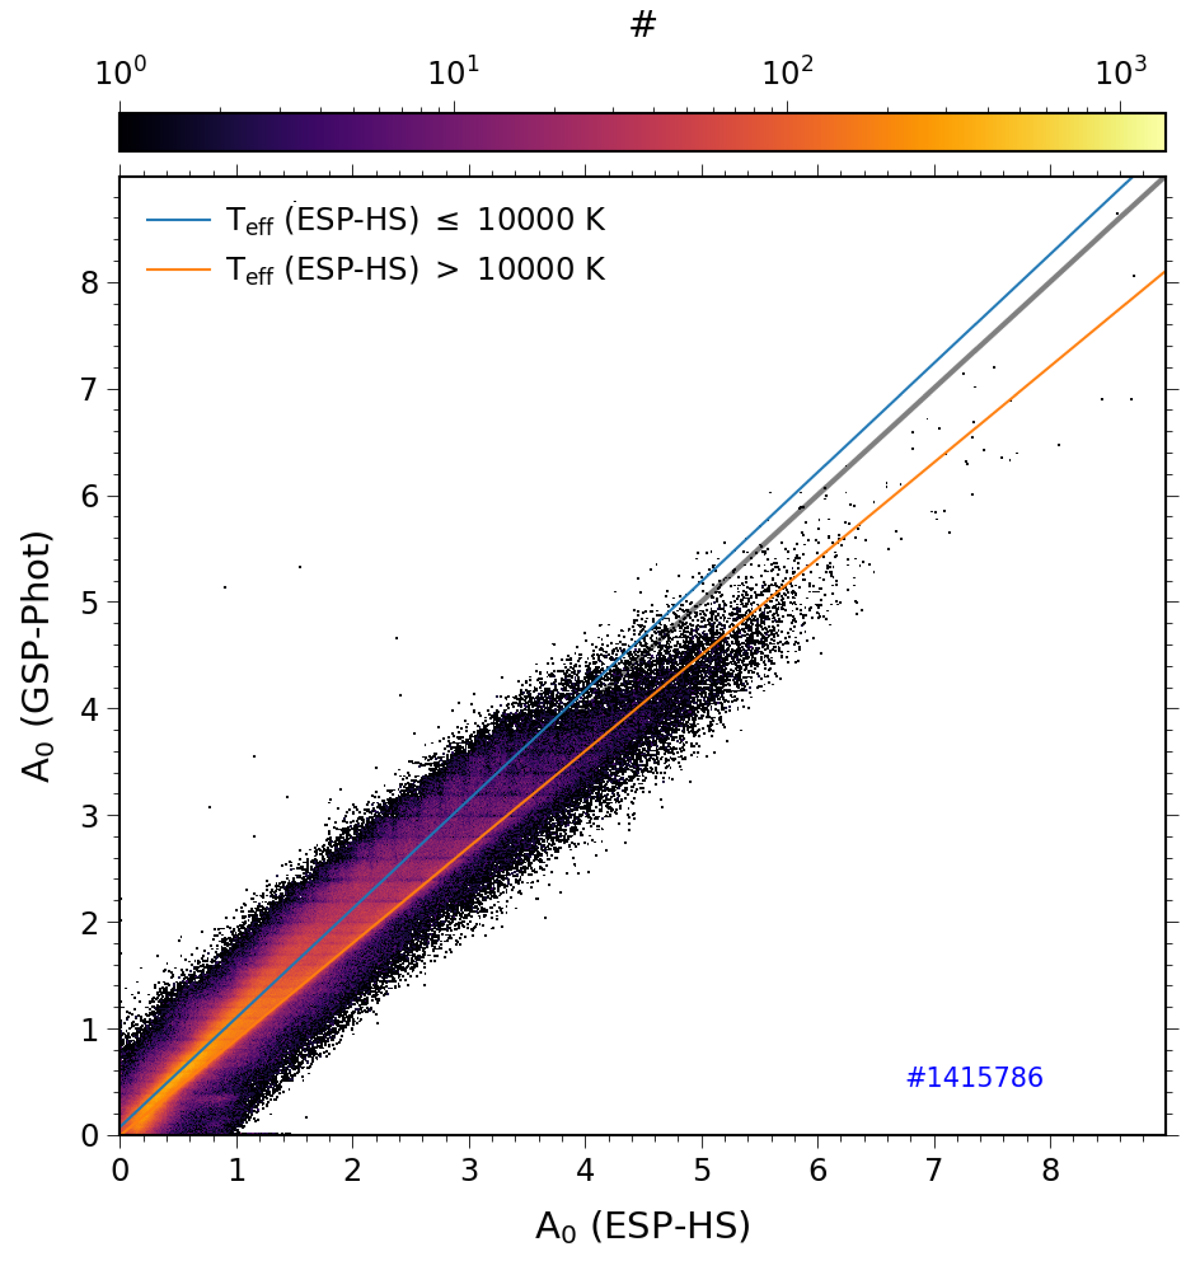
Distribution of the A0 derived by GSP-Phot vs. A0 derived by ESP-HS. The grey diagonal is the identity relation, while the blue and orange lines were fitted through the values obtained for targets cooler and hotter than 10 000 K, respectively.
Current usage metrics show cumulative count of Article Views (full-text article views including HTML views, PDF and ePub downloads, according to the available data) and Abstracts Views on Vision4Press platform.
Data correspond to usage on the plateform after 2015. The current usage metrics is available 48-96 hours after online publication and is updated daily on week days.
Initial download of the metrics may take a while.