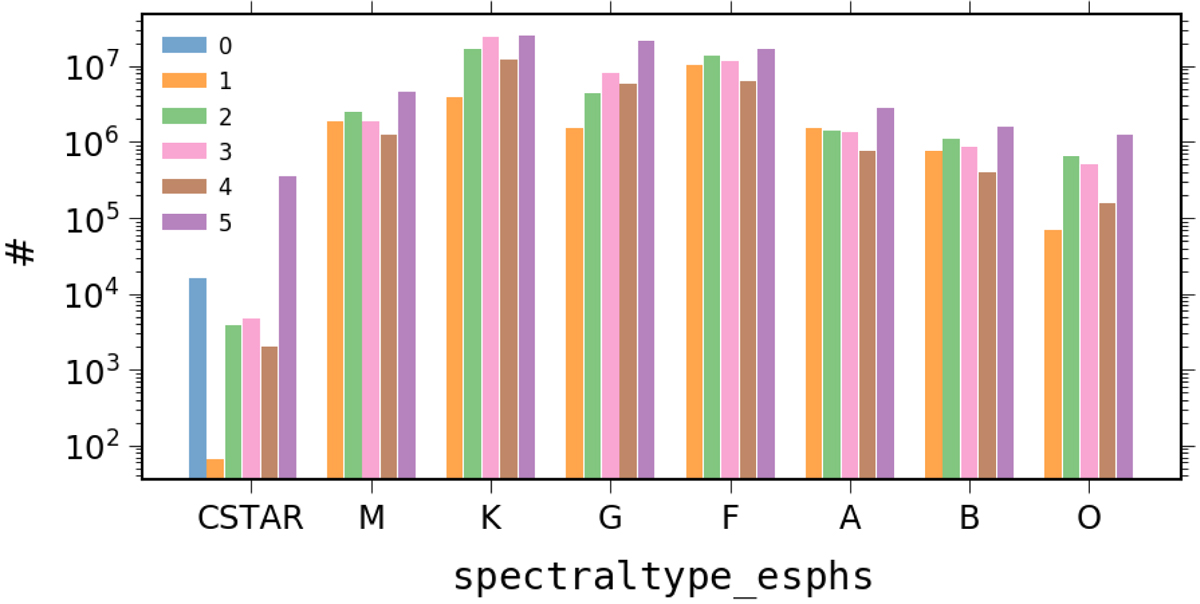
Fig. 13.
Download original image
Histogram of the distribution of spectraltype_esphs which processed sources with G ≤ 17.65. A coloured distinction is made between the different values taken by the quality assessment flag (second digit of flags_esphs). Usually, the flag takes values ranging from 1 to 5, with the lower value indicating higher quality. However, for the CSTAR tag, this value can also be ‘0’.
Current usage metrics show cumulative count of Article Views (full-text article views including HTML views, PDF and ePub downloads, according to the available data) and Abstracts Views on Vision4Press platform.
Data correspond to usage on the plateform after 2015. The current usage metrics is available 48-96 hours after online publication and is updated daily on week days.
Initial download of the metrics may take a while.