Fig. 5.
Download original image
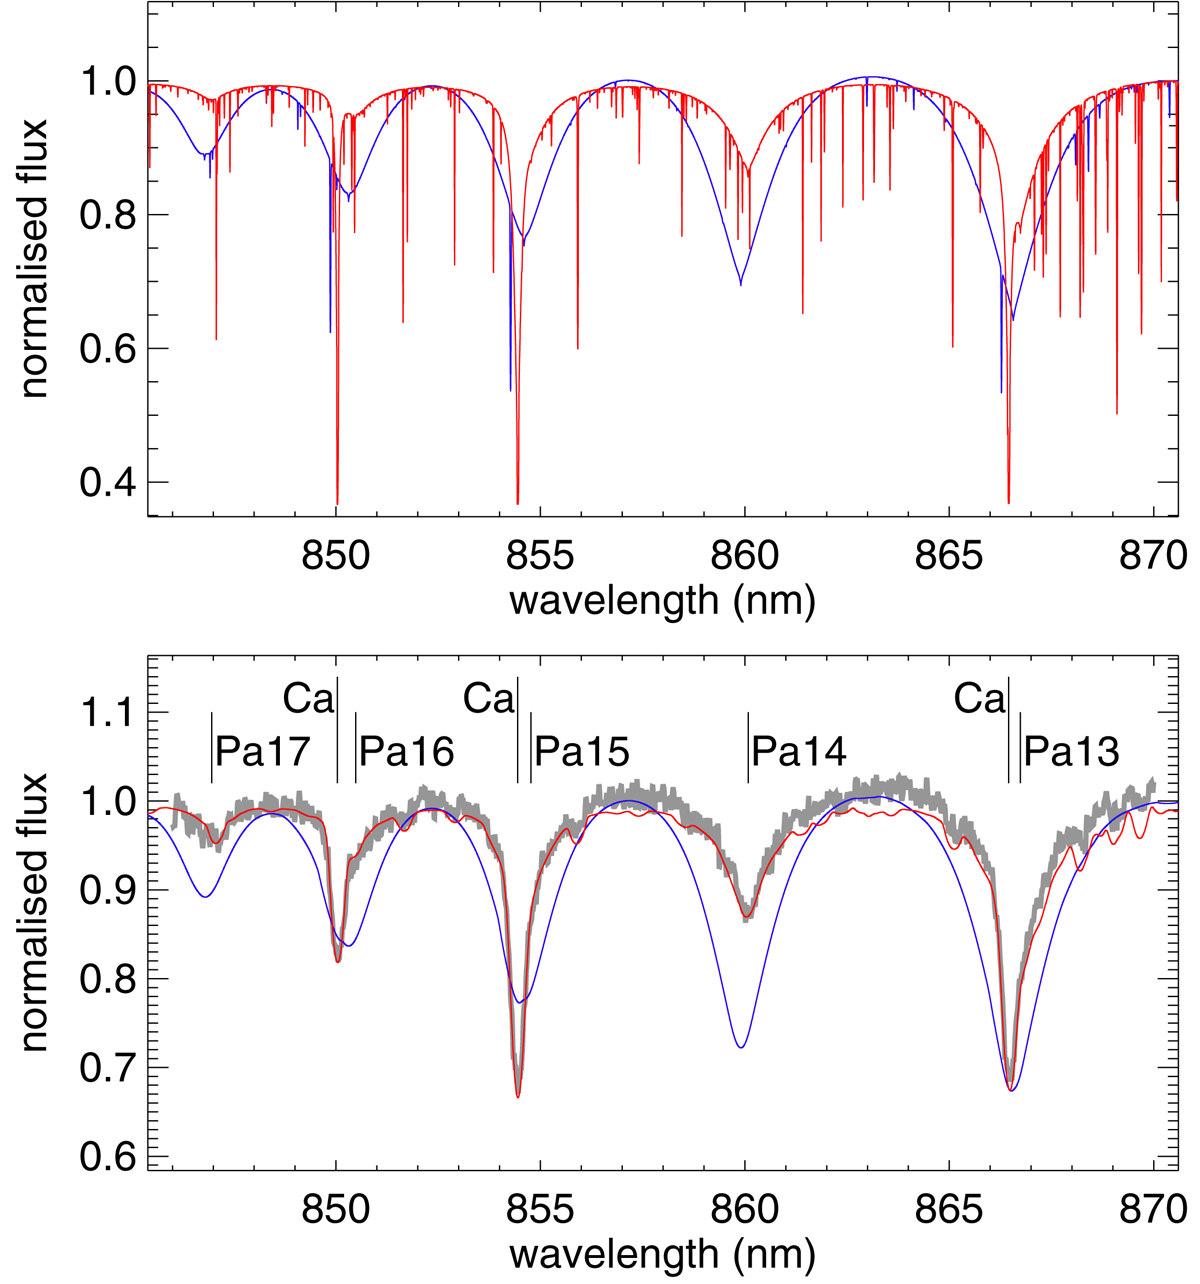
Example of applying ReDetermineApHotStars. Top panel: shows the synthetic spectra: the blue curve (Teff = 11 500 K, log g = 4.0 dex, [M/H] = −0.50 dex) presents data to which ReDetermineApHotStars was not applied, and the red curve shows the best synthetic spectrum as determined by ReDetermineApHotStars (Teff = 7750 K, log g = 4.5 dex, [M/H] = +0.25 dex). Bottom panel: the templates derived from these synthetic spectra: they have been convolved with a broadening velocity of 100 km s−1 (blue curve), and 80 km s−1 (red curve), and with the instrumental profile. They are compared with the observed spectrum of Gaia DR3 51853419339515136 (grey curve). All spectra are at their vacuum rest wavelength, except for the blue curves, which are shifted by −60.9 km s−1; this is the offset we found between the case when ReDetermineApHotStars was applied or was left unused. The template selected by ReDetermineApHotStars (red curve) clearly provides a better fit to the observed spectrum and therefore also gives a more correct radial velocity.
Current usage metrics show cumulative count of Article Views (full-text article views including HTML views, PDF and ePub downloads, according to the available data) and Abstracts Views on Vision4Press platform.
Data correspond to usage on the plateform after 2015. The current usage metrics is available 48-96 hours after online publication and is updated daily on week days.
Initial download of the metrics may take a while.