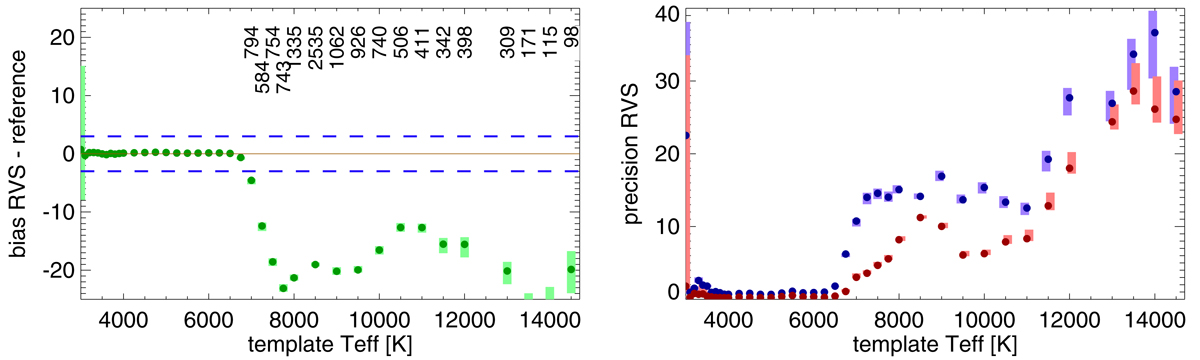
Fig. 4.
Download original image
Preliminary radial velocities compared to their reference values as a function of the template effective temperature. ReDetermineApHotStars was not applied to these data. Left panel: bias of the radial velocity of the stars (RVS value minus reference value). Each point on the plot presents the median of the bias of all stars having this Teff value (the template effective temperatures take on only discrete values). The coloured bar around it gives the uncertainty on the median; in most cases, this uncertainty is smaller than the symbol. The results for cooler stars are also included in this figure to show the difference in quality of the radial velocity determination. The dashed blue lines indicate ±3 km s−1. The numbers at the top show how many stars correspond to this temperature. Right panel: precision. The blue symbols give the external uncertainty (dispersion of RVS value minus reference value), while the red symbols give the internal precision, i.e., the intrinsic uncertainty as derived by the code. The uncertainties on these values are given by the coloured bars; for the higher Teff values, they have been offset slightly in temperature to avoid overlap. The plots include only stars with grvs_mag ≤ 12 mag.
Current usage metrics show cumulative count of Article Views (full-text article views including HTML views, PDF and ePub downloads, according to the available data) and Abstracts Views on Vision4Press platform.
Data correspond to usage on the plateform after 2015. The current usage metrics is available 48-96 hours after online publication and is updated daily on week days.
Initial download of the metrics may take a while.