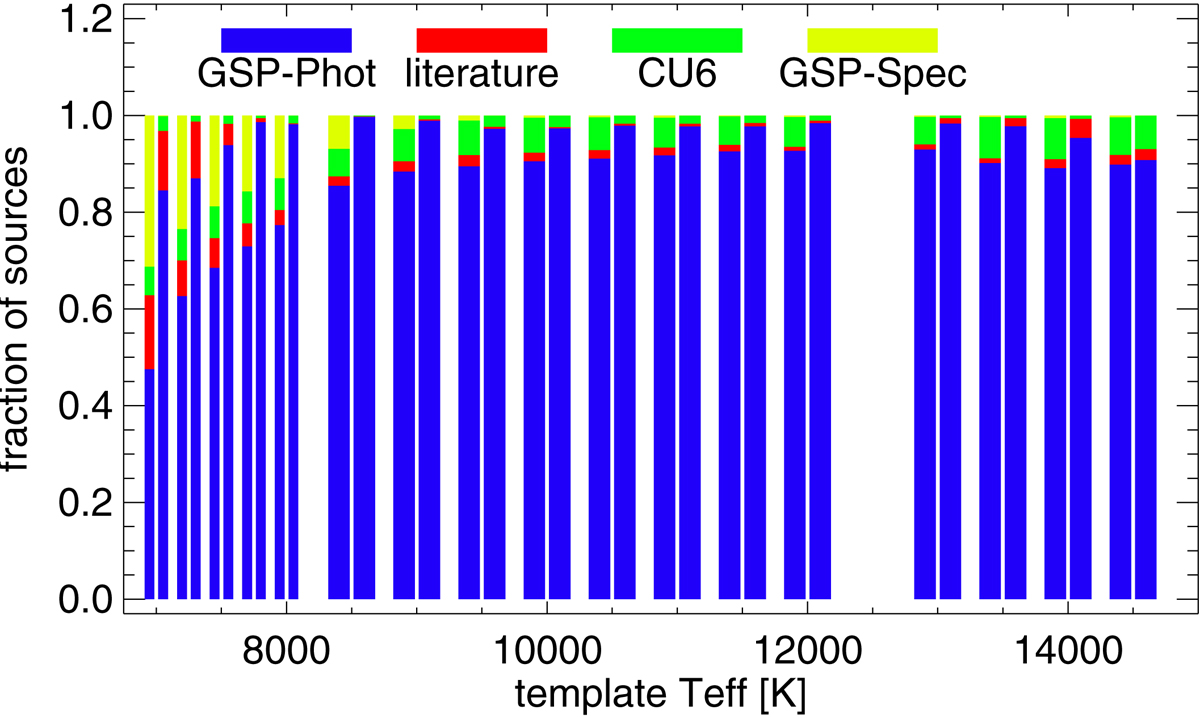
Fig. 3.
Download original image
Histogram showing the fraction of the stars that obtained their template parameters from the various input possibilities. The x-axis shows the template effective temperature. Each histogram bar is split into two parts: the left-hand side of each bar shows the distribution for grvs_mag ≤ 12 mag, and the right-hand side of each bar is for grvs_mag > 12 mag.
Current usage metrics show cumulative count of Article Views (full-text article views including HTML views, PDF and ePub downloads, according to the available data) and Abstracts Views on Vision4Press platform.
Data correspond to usage on the plateform after 2015. The current usage metrics is available 48-96 hours after online publication and is updated daily on week days.
Initial download of the metrics may take a while.