Fig. 6.
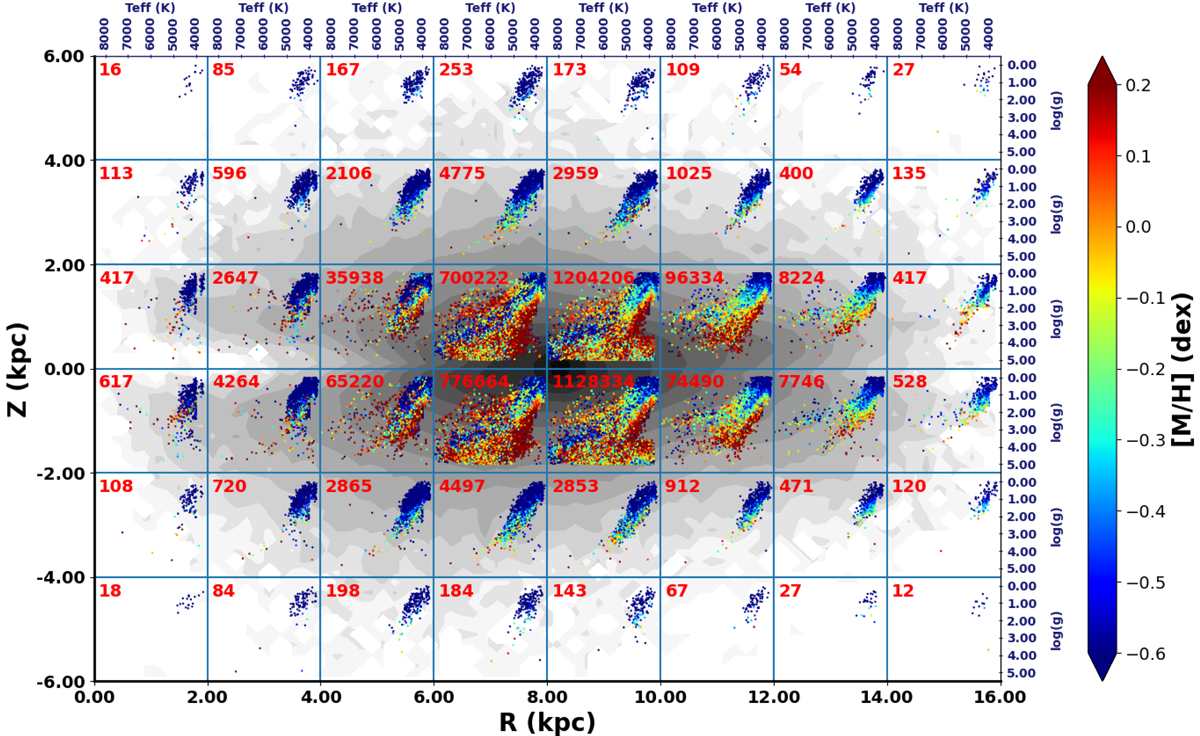
Download original image
Kiel diagrams across the Milky Way for the Medium Quality sample, colour coded according to the median of the mean metallicity. The number of stars in each subpanel is indicated in its upper left corner. The global (R, Z) distribution of Fig. 5 (bottom row) is shown in the background with grey levels. Moving away from the Sun, the sample becomes dominated by intrinsically bright giants.
Current usage metrics show cumulative count of Article Views (full-text article views including HTML views, PDF and ePub downloads, according to the available data) and Abstracts Views on Vision4Press platform.
Data correspond to usage on the plateform after 2015. The current usage metrics is available 48-96 hours after online publication and is updated daily on week days.
Initial download of the metrics may take a while.