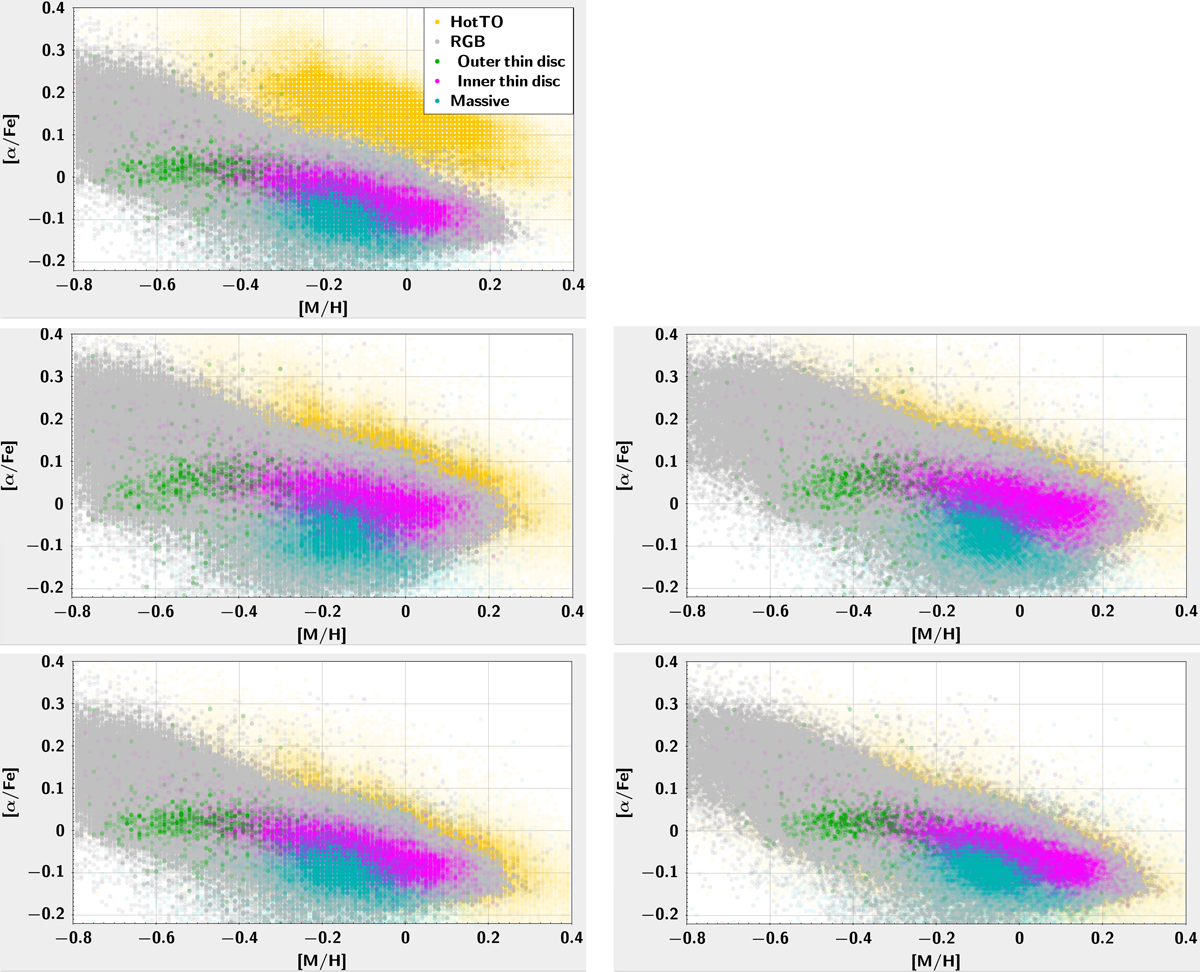
Fig. D.1.
Download original image
Illustration of the impact of different calibrations on the observed [α/Fe] vs. [M/H] trends for the samples defined in Sect. 3.2: HotTO (orange), RGB (grey, with the inner and outer thin disc in pink and green, respectively), and Massive (turquoise) samples. Upper panel: Raw data (no calibration). Left middle panel: Calibrated [α/Fe] based on log(g) and no [M/H] calibration. This is the solution used throughout the different sections of this article. Right middle panel: Calibrated [α/Fe] and [M/H] based on log(g). Left lower panel: Calibrated [α/Fe] based on Teff and no [M/H] calibration. Right left panel: calibrated [α/Fe] and [M/H] based on Teff.
Current usage metrics show cumulative count of Article Views (full-text article views including HTML views, PDF and ePub downloads, according to the available data) and Abstracts Views on Vision4Press platform.
Data correspond to usage on the plateform after 2015. The current usage metrics is available 48-96 hours after online publication and is updated daily on week days.
Initial download of the metrics may take a while.