Fig. 36.
Download original image
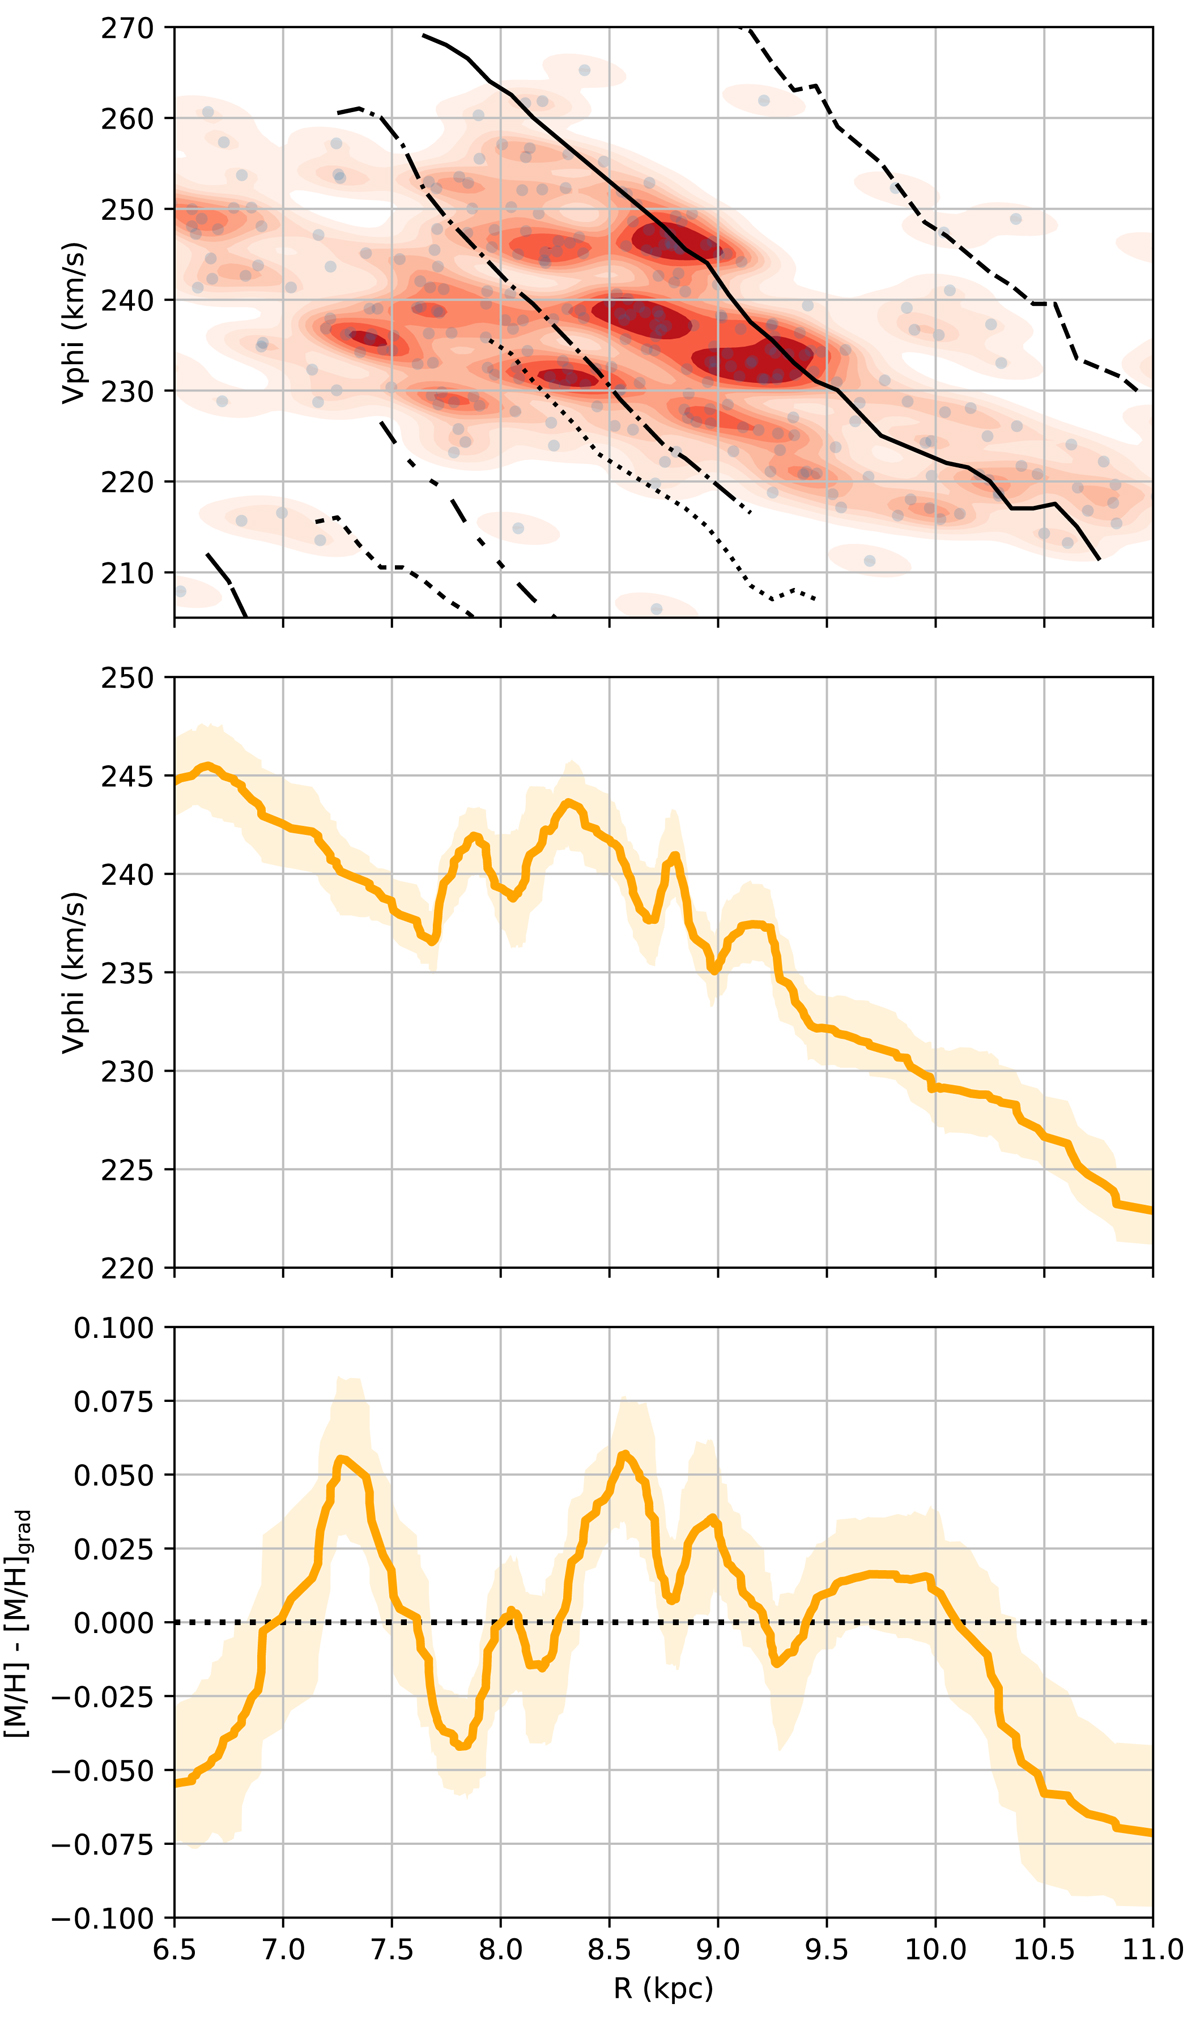
Kinematic features in the radial metallicity distribution as traced by open clusters. Top: distribution of open clusters in the Vϕ–R diagram. The 332 open clusters with [M/H] estimation are shown as grey dots. The red area shows the kernel density estimate of that sample. The Galactic ridges identified by Ramos et al. (2018) are plotted as in Fig. 21. Middle: locally weighted scatterplot smoothing (LOWESS) regression of cluster Vϕ as a function of R (solid line). The shaded area shows the 90% confidence interval of the LOWESS functions obtained by sampling within the uncertainties of the two variables. Bottom: Residuals between the cluster [M/H] values and the metallicities predicted by the radial metallicity gradient as in Table 3 as a function of R. As in the middle panel, the solid line shows the LOWESS function and the shaded area shows its 90% confidence interval.
Current usage metrics show cumulative count of Article Views (full-text article views including HTML views, PDF and ePub downloads, according to the available data) and Abstracts Views on Vision4Press platform.
Data correspond to usage on the plateform after 2015. The current usage metrics is available 48-96 hours after online publication and is updated daily on week days.
Initial download of the metrics may take a while.