Fig. 34.
Download original image
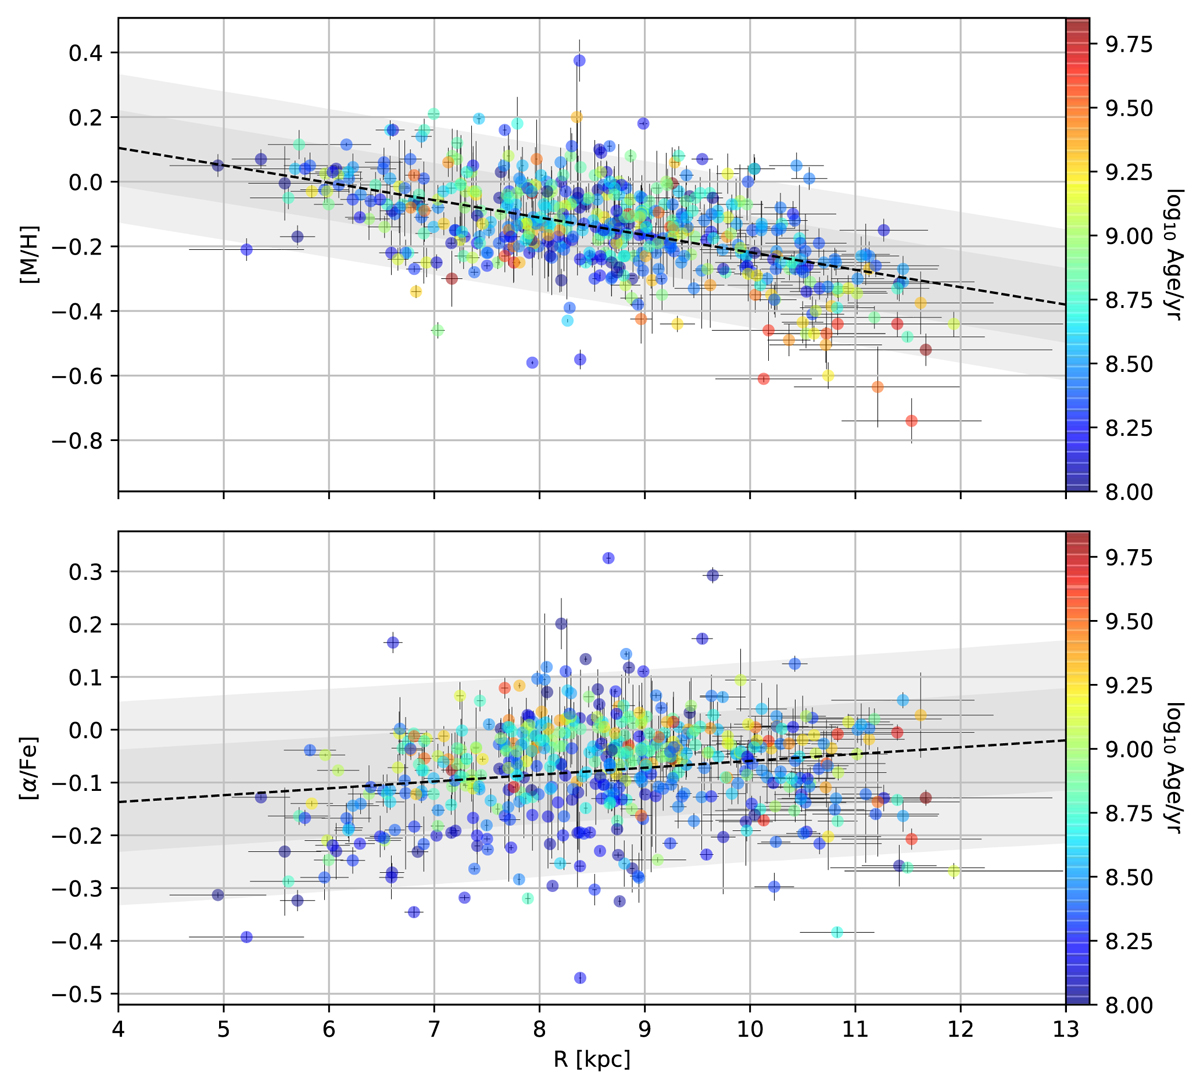
Galactic radial metallicity and [α/Fe] gradients traced by open clusters. Top: cluster [M/H] values as a function of their Galactocentric distance R. Clusters are marked by circles colour coded according to their age. The grey shaded areas represent the 68% and 95% confidence intervals of the linear models resulting from the Bayesian regression, while the black dashed line traces the most probable model. Bottom: Cluster [α/Fe] values as a function of their Galactocentric distance R. Symbol colours and shaded areas are the same as those in the top panel.
Current usage metrics show cumulative count of Article Views (full-text article views including HTML views, PDF and ePub downloads, according to the available data) and Abstracts Views on Vision4Press platform.
Data correspond to usage on the plateform after 2015. The current usage metrics is available 48-96 hours after online publication and is updated daily on week days.
Initial download of the metrics may take a while.