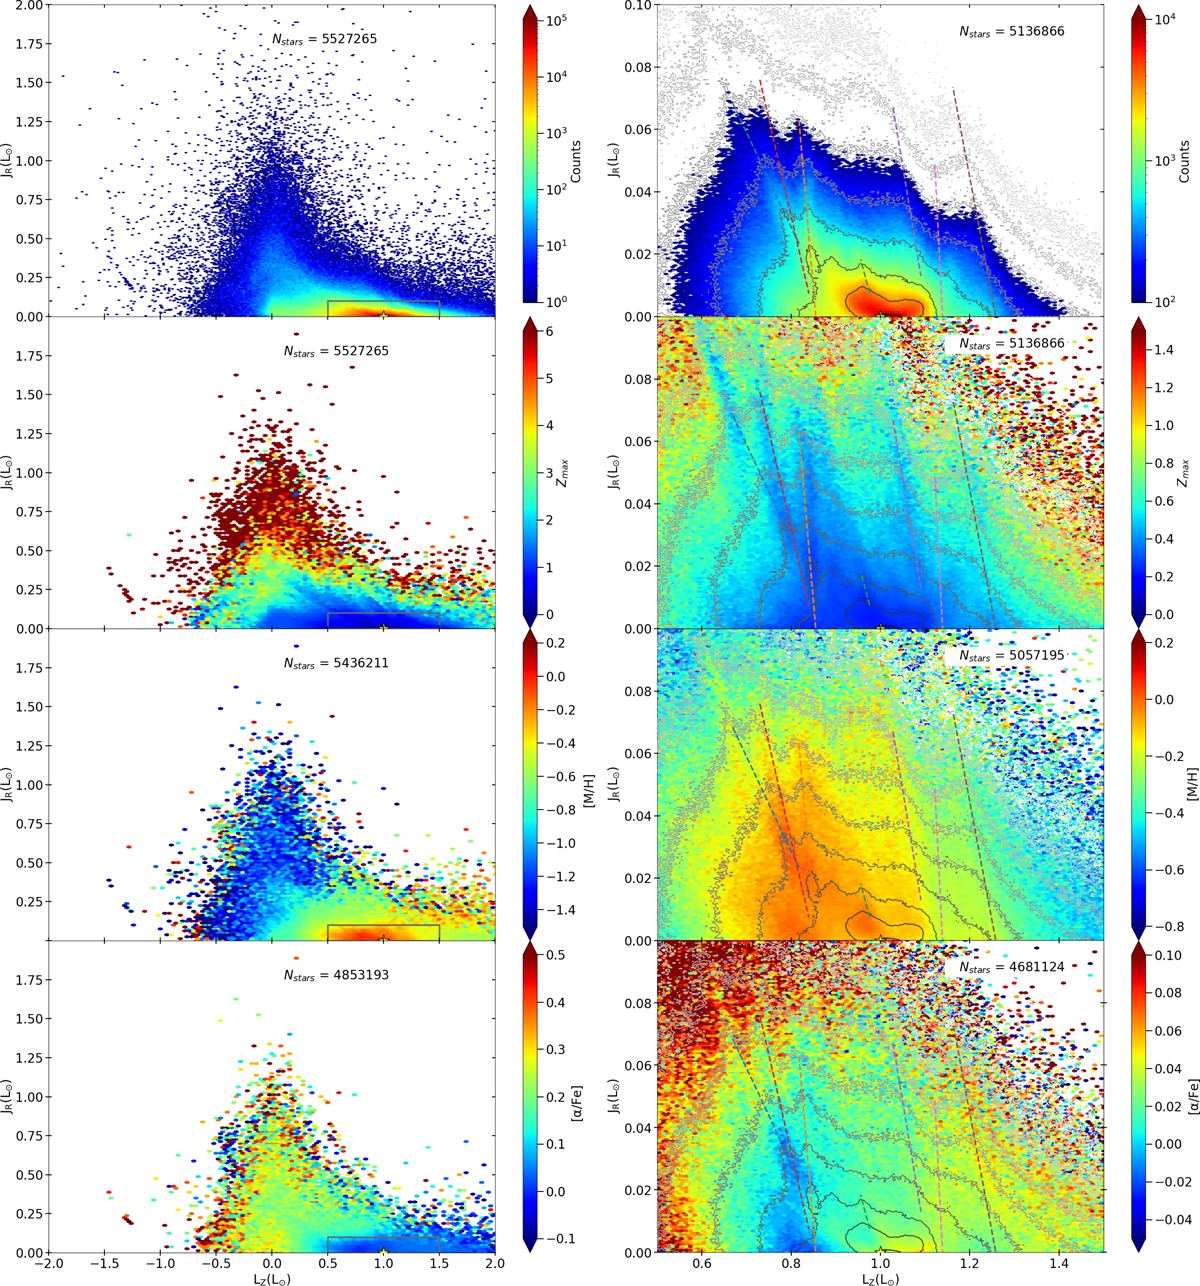
Fig. 31.
Download original image
Distribution of the General sample in the JR − LZ diagram colour coded according to density (upper panels), median maximum distance above the Galactic plane Zmax (second panels), median metallicity (third panels), and median [α/Fe] (lower panels). The grey boxes in the left panels indicate the areas for which a zoomed-in version is shown in the right column. The contour lines of the zoomed density plot are included in the right column as a visual reference, while the tentative positions of the ridges are denoted by the dashed lines. Bins with less than ten stars are omitted in the zoomed density plot to enhance the gradient in the colour code. The position of the LSR at (JR, LZ) = (0, L⊙) is denoted by the star symbol.
Current usage metrics show cumulative count of Article Views (full-text article views including HTML views, PDF and ePub downloads, according to the available data) and Abstracts Views on Vision4Press platform.
Data correspond to usage on the plateform after 2015. The current usage metrics is available 48-96 hours after online publication and is updated daily on week days.
Initial download of the metrics may take a while.