Open Access
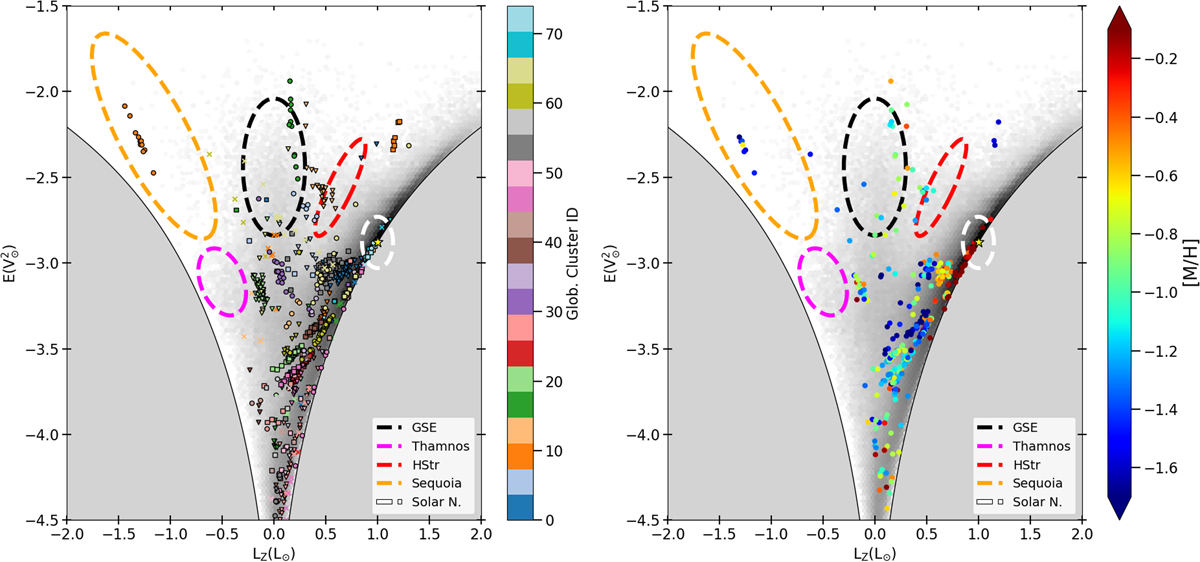
Fig. 29.
Download original image
Distribution of globular cluster stars in the E vs. LZ diagram (coloured symbols). In the left panel, each cluster is denoted by a different colour and symbol, while in the right panel the colour code represents the metallicity. The density plot in the background corresponds to the General sample.
Current usage metrics show cumulative count of Article Views (full-text article views including HTML views, PDF and ePub downloads, according to the available data) and Abstracts Views on Vision4Press platform.
Data correspond to usage on the plateform after 2015. The current usage metrics is available 48-96 hours after online publication and is updated daily on week days.
Initial download of the metrics may take a while.