Fig. 28.
Download original image
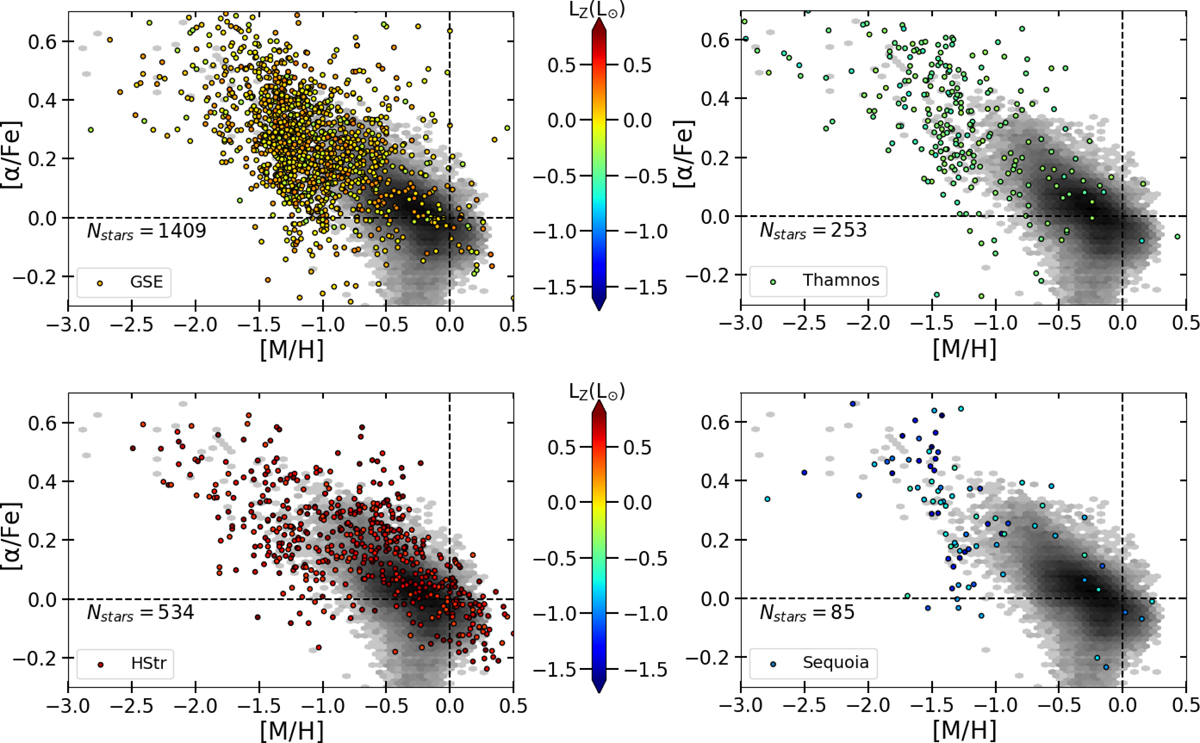
[α/Fe] versus [M/H] diagram for all the stars contained in the regions shown in Fig. 25 that satisfy the Medium Quality selection criteria. The colour code represents the vertical component of the angular momentum LZ. The density plot in the background corresponds to the Medium Quality subsample of solar neighbourhood stars.
Current usage metrics show cumulative count of Article Views (full-text article views including HTML views, PDF and ePub downloads, according to the available data) and Abstracts Views on Vision4Press platform.
Data correspond to usage on the plateform after 2015. The current usage metrics is available 48-96 hours after online publication and is updated daily on week days.
Initial download of the metrics may take a while.