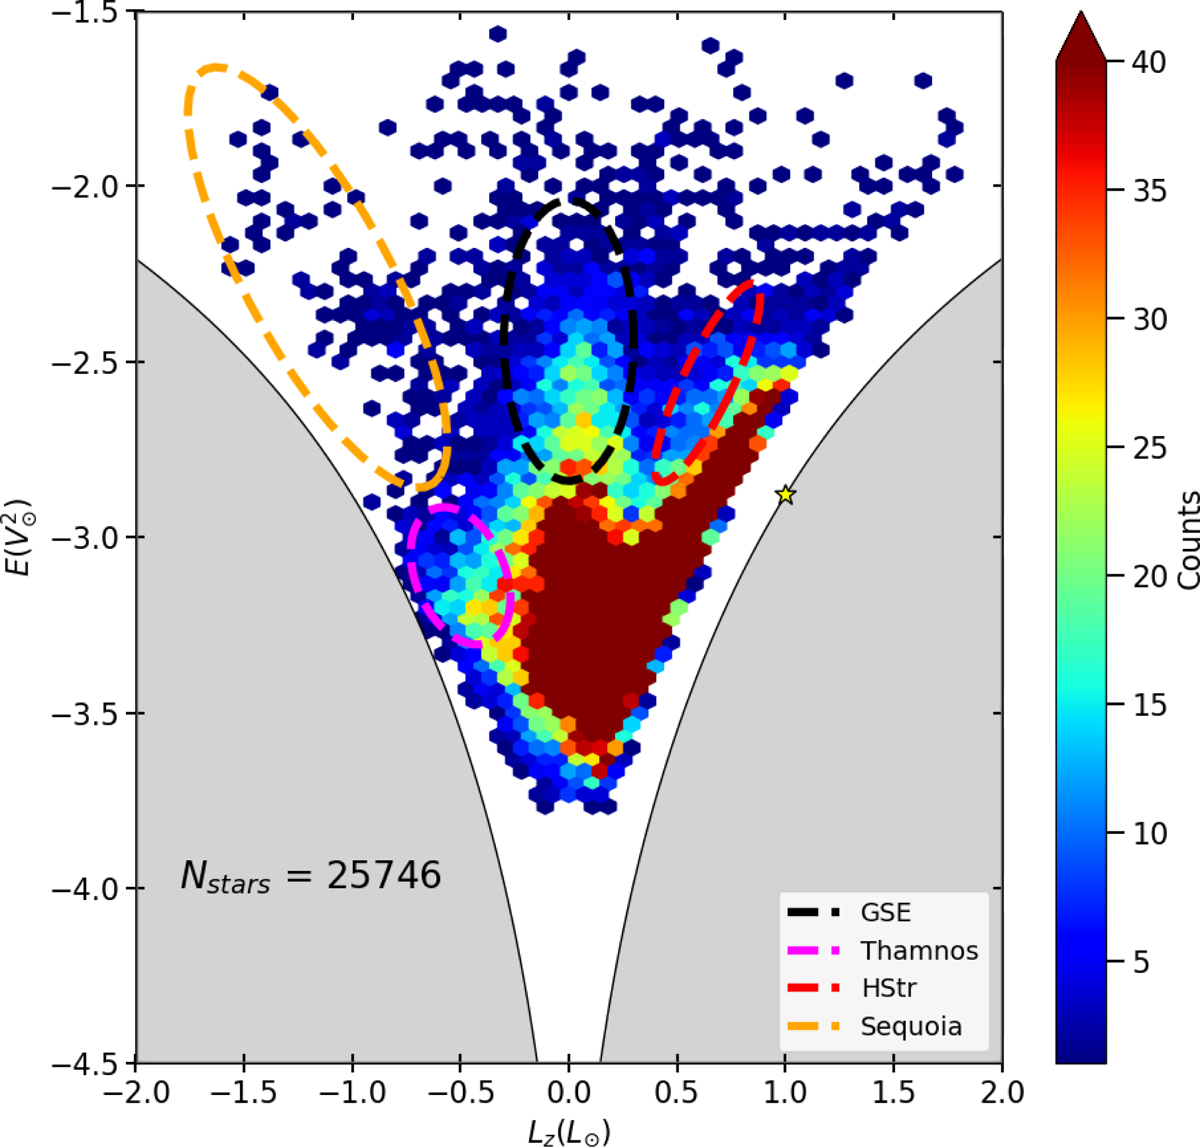
Fig. 26.
Download original image
Zoomed-in version of the area enclosed by grey rectangles in Fig. 25 imposing the selection criteria described in Koppelman et al. (2019). The colour code is saturated in the high-density regions to emphasise the details of the selected areas. No solar neighbourhood area is selected in this figure because it would contain no stars due to the applied selection criteria.
Current usage metrics show cumulative count of Article Views (full-text article views including HTML views, PDF and ePub downloads, according to the available data) and Abstracts Views on Vision4Press platform.
Data correspond to usage on the plateform after 2015. The current usage metrics is available 48-96 hours after online publication and is updated daily on week days.
Initial download of the metrics may take a while.