Fig. 20.
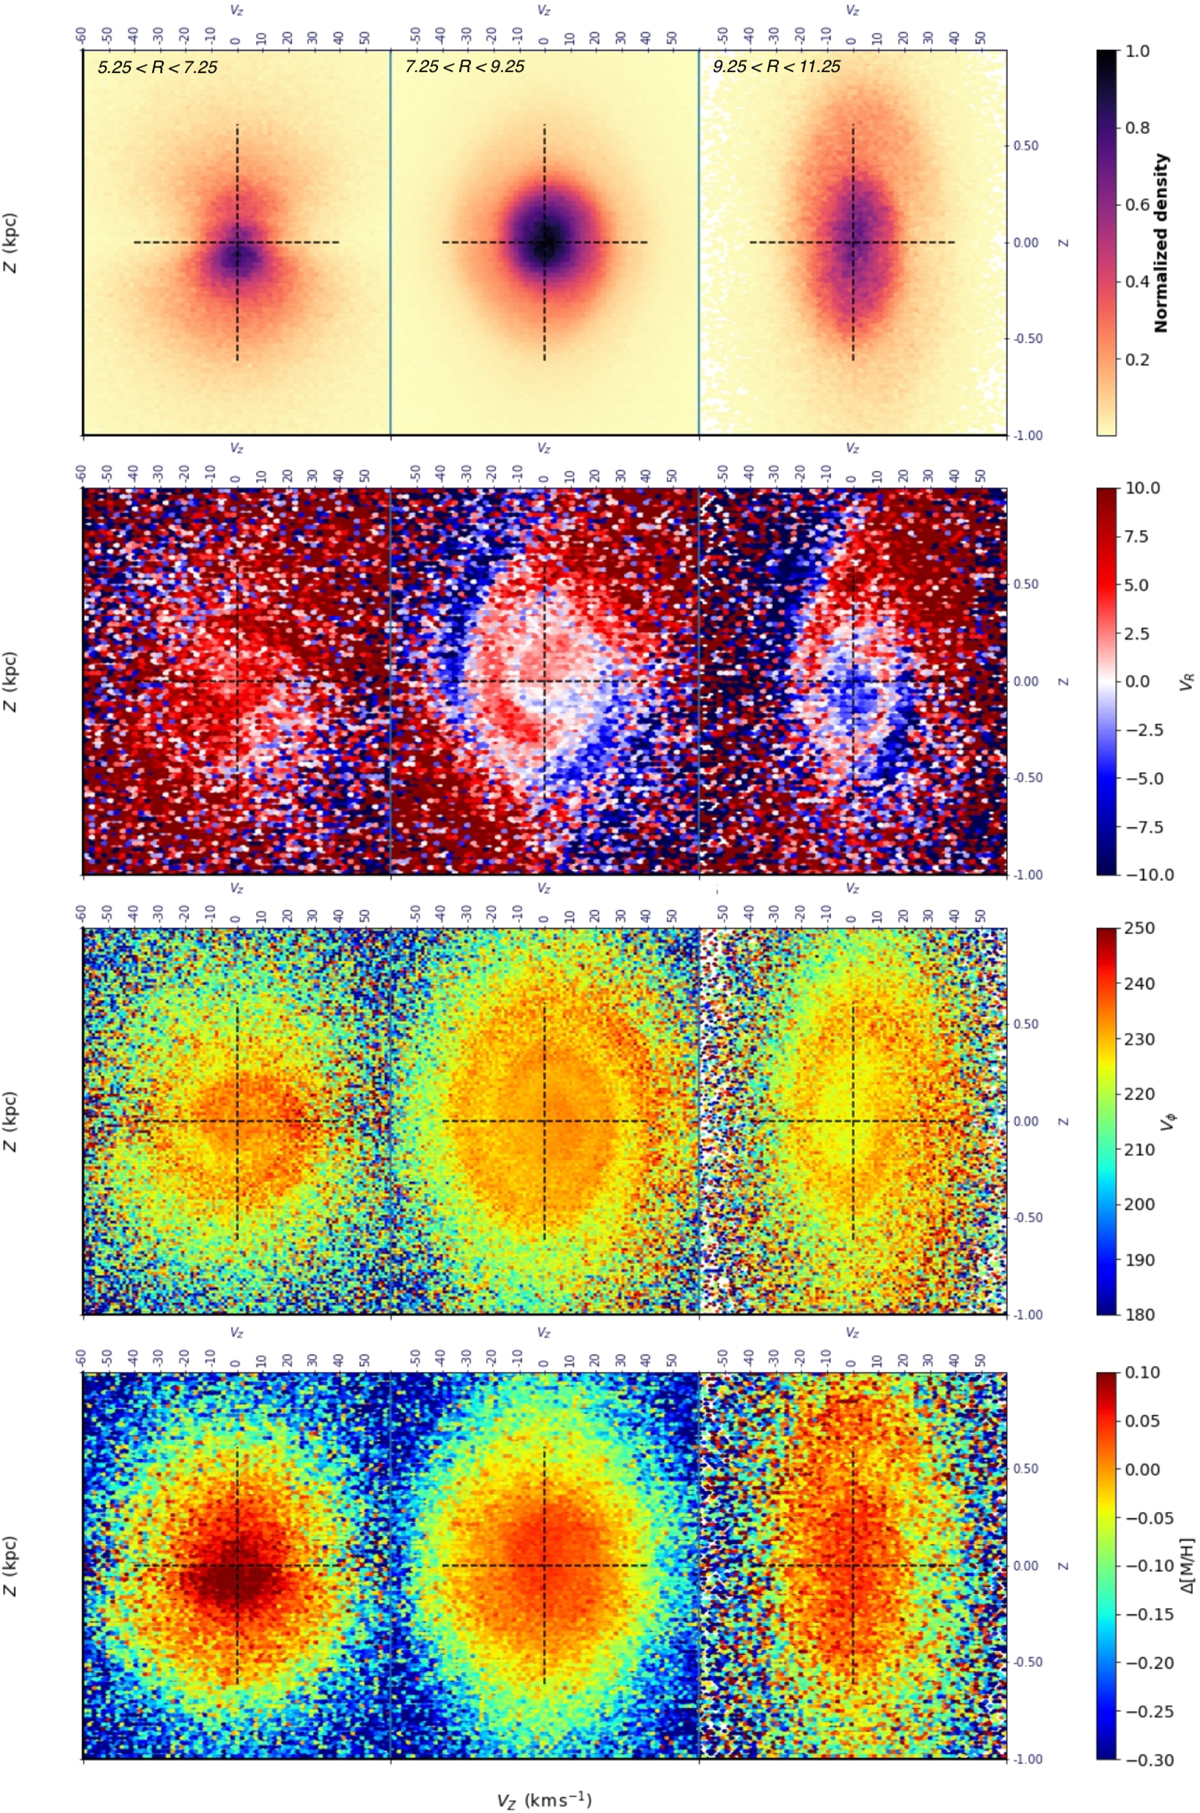
Download original image
Galactic map of the velocity distribution VZ vs. Z of the Medium Quality sample for 5.25 < R < 11.25 kpc. From left to right: the radial range is shown in three rings at R = 6.25, 8.25, and 10.25 kpc, each of 2 kpc in width. From top to bottom: normalised density distribution, Z − VZ plane coloured as a function of median VR, Vϕ, and Δ[M/H].
Current usage metrics show cumulative count of Article Views (full-text article views including HTML views, PDF and ePub downloads, according to the available data) and Abstracts Views on Vision4Press platform.
Data correspond to usage on the plateform after 2015. The current usage metrics is available 48-96 hours after online publication and is updated daily on week days.
Initial download of the metrics may take a while.