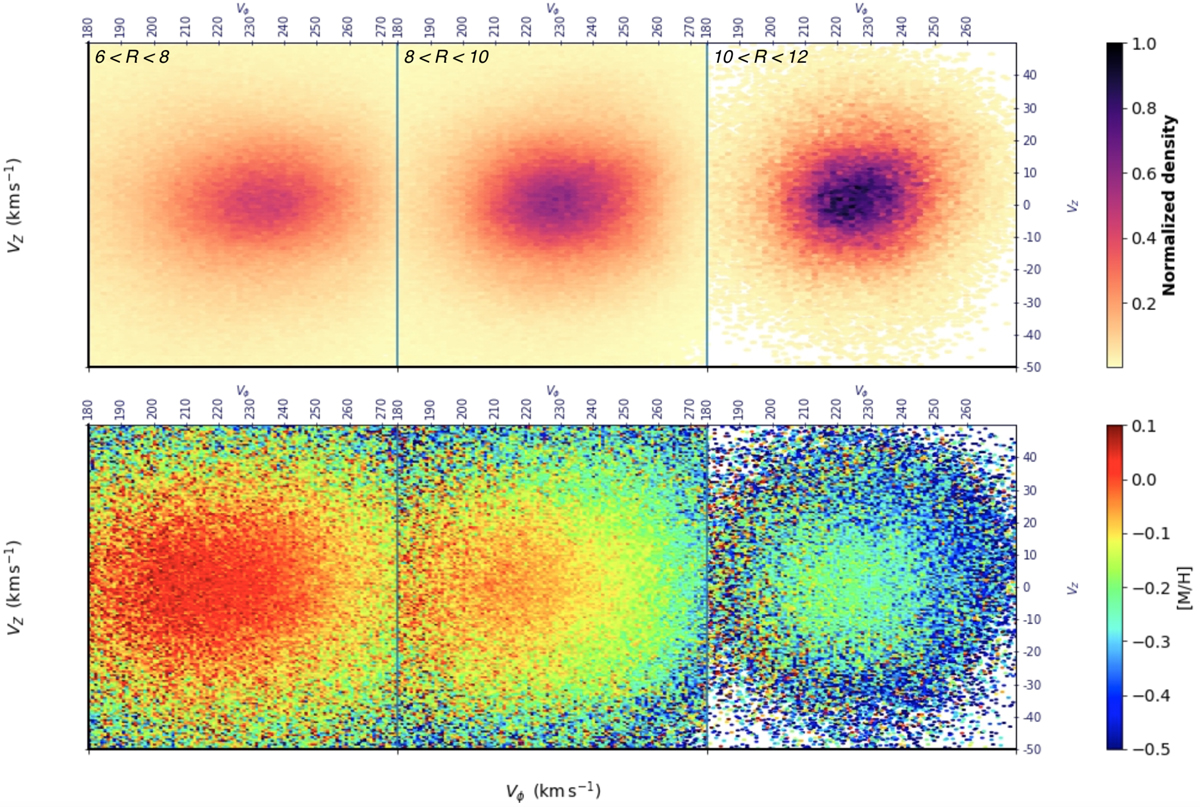
Fig. 18.
Download original image
Galactic map of the velocity distribution VZ vs. Vϕ of giant stars (log(g) < 3.5) with |Z|< 1 kpc belonging to the Medium Quality sample. The objects are shown, from left to right, in three Galactocentric distance ranges: 6 < R < 8 kpc (883 621 giants), 8 < R < 10 kpc (867 582 giants), and 10 < R < 12 kpc (138, 208 giants). Top panel: normalised density distribution. Bottom panel: distribution colour coded according to [M/H].
Current usage metrics show cumulative count of Article Views (full-text article views including HTML views, PDF and ePub downloads, according to the available data) and Abstracts Views on Vision4Press platform.
Data correspond to usage on the plateform after 2015. The current usage metrics is available 48-96 hours after online publication and is updated daily on week days.
Initial download of the metrics may take a while.