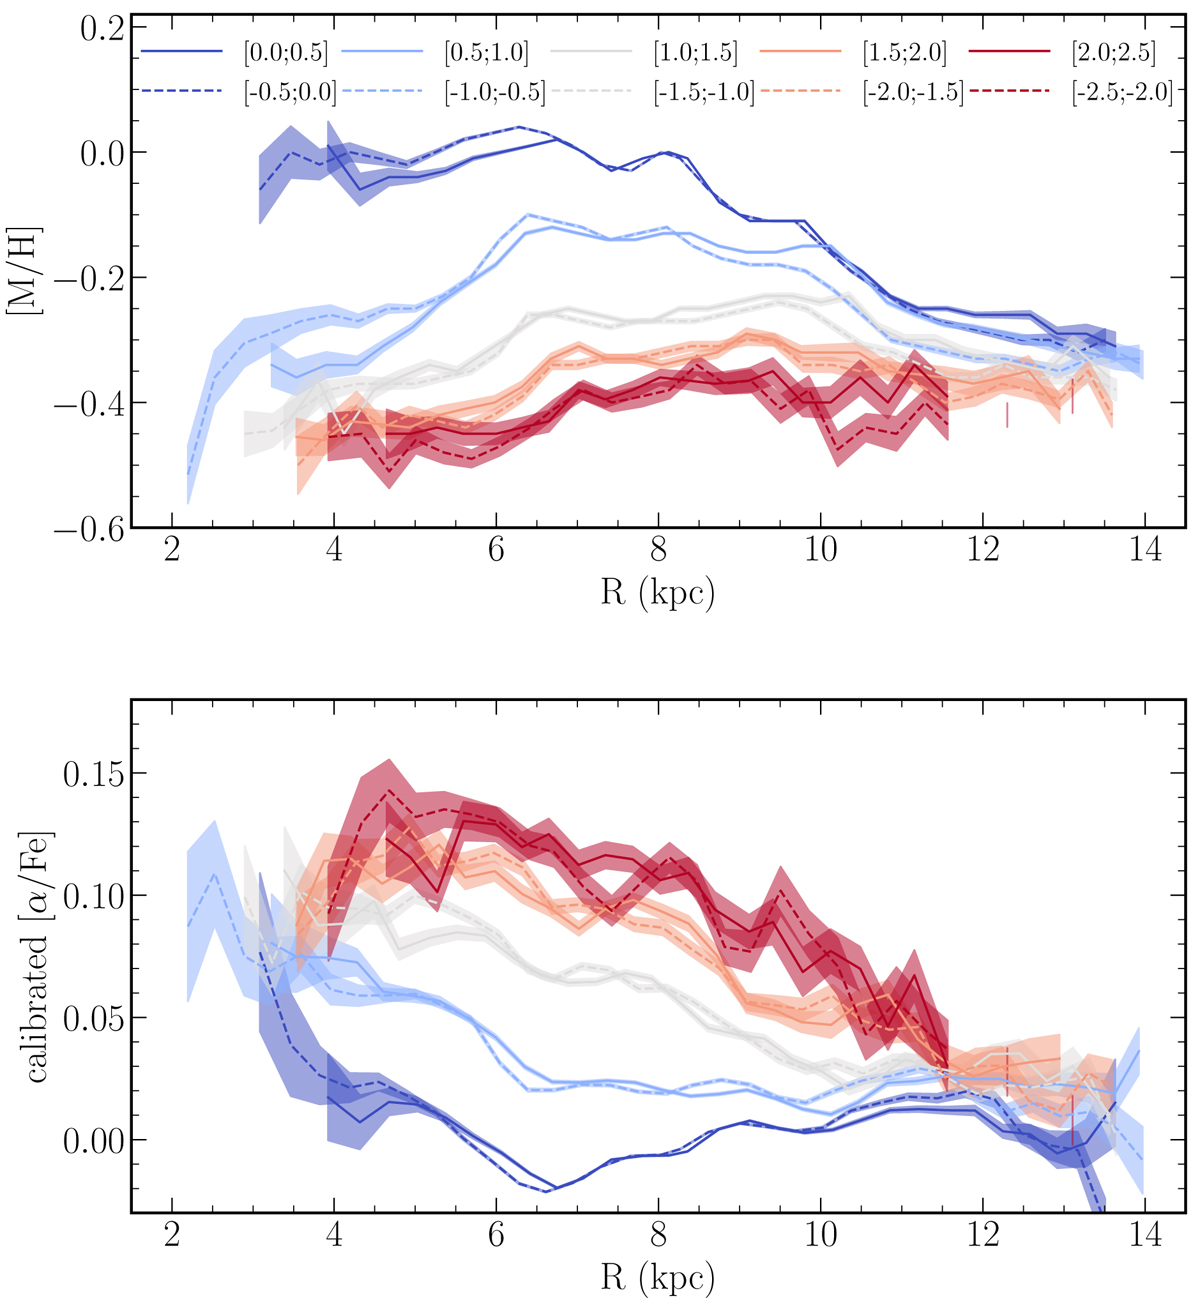
Fig. 13.
Download original image
Radial gradients for metallicity (top) and [α/Fe] (bottom) for different distances from the Galactic midplane (in kpc; see the legend). The trends are computed as running medians in bins of 0.5 kpc, with a 40 percent overlap, provided that at least 50 stars are available to compute the median. The shaded areas represent the Poisson uncertainty on the trends. The colours, which are associated to Z distances from the plane, are similar if the |Z| range is the same.
Current usage metrics show cumulative count of Article Views (full-text article views including HTML views, PDF and ePub downloads, according to the available data) and Abstracts Views on Vision4Press platform.
Data correspond to usage on the plateform after 2015. The current usage metrics is available 48-96 hours after online publication and is updated daily on week days.
Initial download of the metrics may take a while.