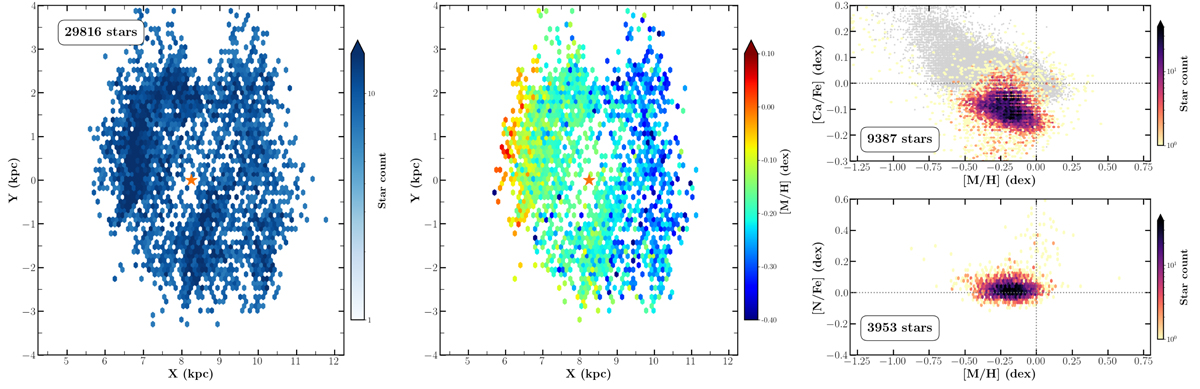
Fig. 11.
Download original image
Same as Fig. 9 but for Massive stars located within 400 pc of the Galactic plane, thus focusing attention on the thin disc. The spiral arm structure is visible in the left and central panels. Calcium and nitrogen abundance distributions are shown in the right top and bottom panels, respectively. For comparison, the distribution of the RGB stars in terms of calcium abundance is shown in grey in the top panel.
Current usage metrics show cumulative count of Article Views (full-text article views including HTML views, PDF and ePub downloads, according to the available data) and Abstracts Views on Vision4Press platform.
Data correspond to usage on the plateform after 2015. The current usage metrics is available 48-96 hours after online publication and is updated daily on week days.
Initial download of the metrics may take a while.