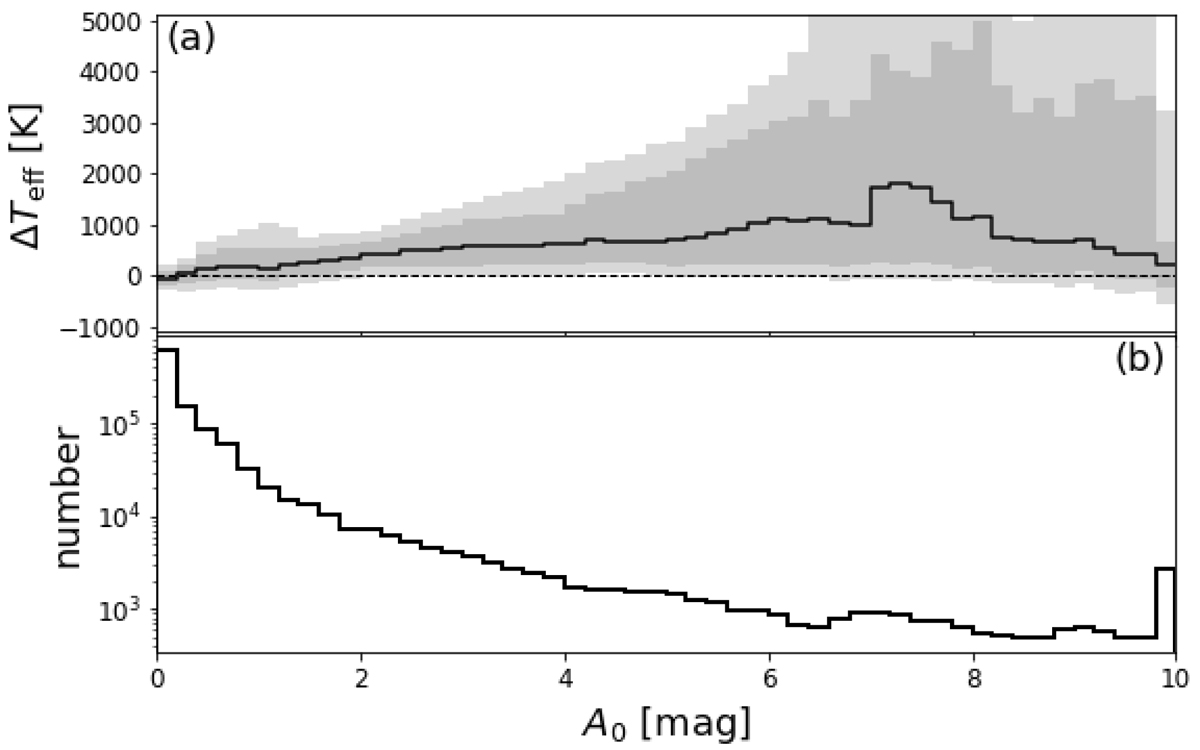
Fig. 7.
Download original image
Impact of extinction onto differences in Teff between results and literature values. Panel (a): differences in Teff between our GSP-Phot results and literature values as function of estimated extinction A0 for the joint samples from APOGEE DR16 (Jönsson et al. 2020), GALAH DR3 (Buder et al. 2021), LAMOST DR4 (Wu et al. 2011, 2014), and RAVE DR6 (Steinmetz et al. 2020). If the same star appears in more than one literature resource, it enters this plot multiple times with identical GSP-Phot results but different literature values. The data are binned into A0 ranges of 0.2 mag, where the solid black line indicates the median residual and the two shaded regions show the 5th-to-95th percentiles and the 16th-to-84th percentiles, respectively. Panel (b): distribution of A0 estimates in this sample.
Current usage metrics show cumulative count of Article Views (full-text article views including HTML views, PDF and ePub downloads, according to the available data) and Abstracts Views on Vision4Press platform.
Data correspond to usage on the plateform after 2015. The current usage metrics is available 48-96 hours after online publication and is updated daily on week days.
Initial download of the metrics may take a while.