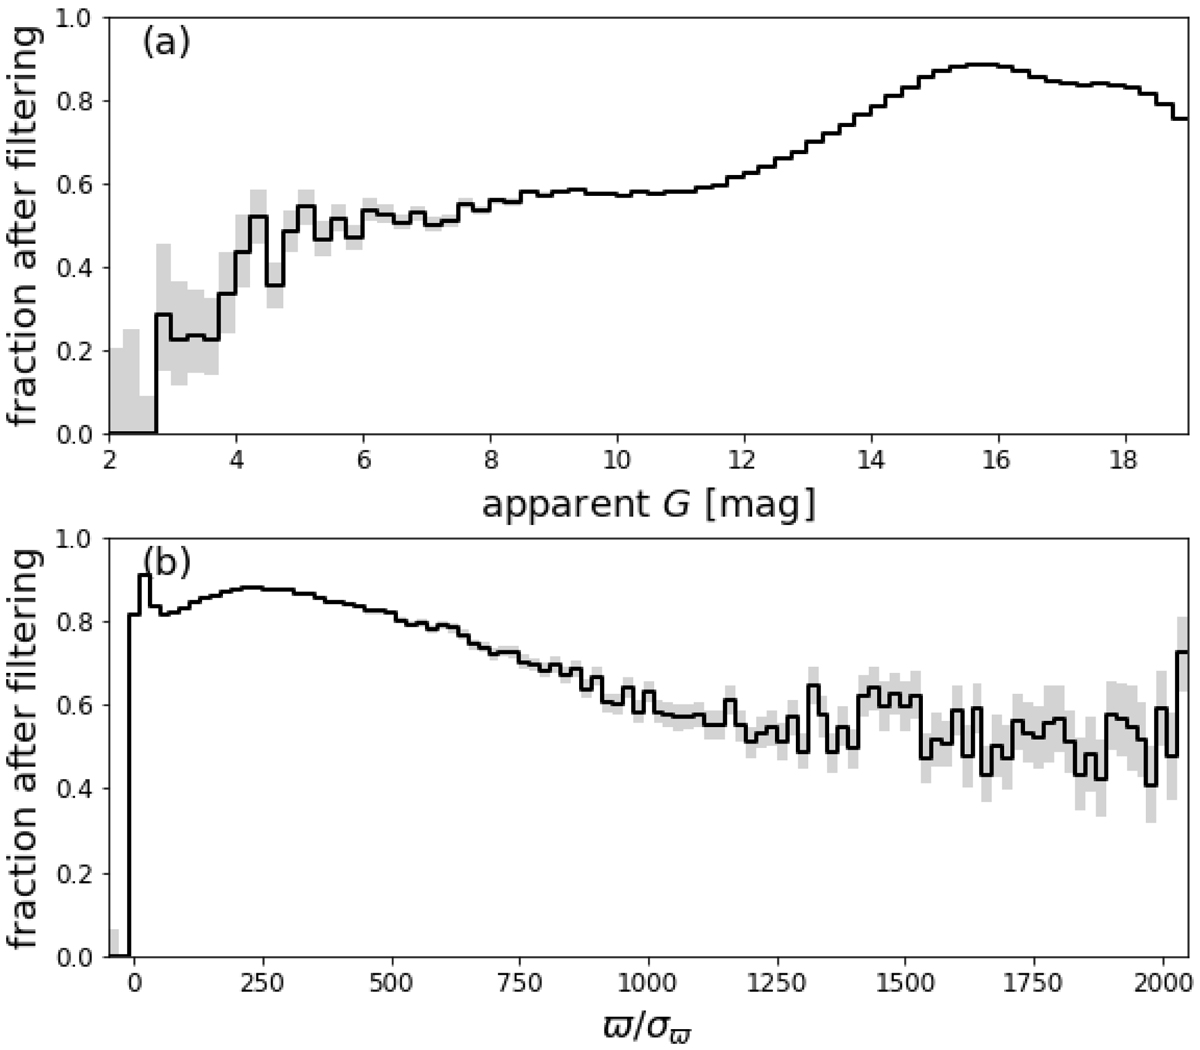
Fig. 3.
Download original image
Fraction of sources surviving the filtering described in Sect. 3.3 as a function of apparent G magnitude (panel (a)) and parallax signal-to-noise ratio (panel (b)). Both panels use a random subset of about 100 million sources with G < 19. Grey intervals indicate the horizontally decreasing intervals of 68% confidence assuming a beta distribution in each bin.
Current usage metrics show cumulative count of Article Views (full-text article views including HTML views, PDF and ePub downloads, according to the available data) and Abstracts Views on Vision4Press platform.
Data correspond to usage on the plateform after 2015. The current usage metrics is available 48-96 hours after online publication and is updated daily on week days.
Initial download of the metrics may take a while.