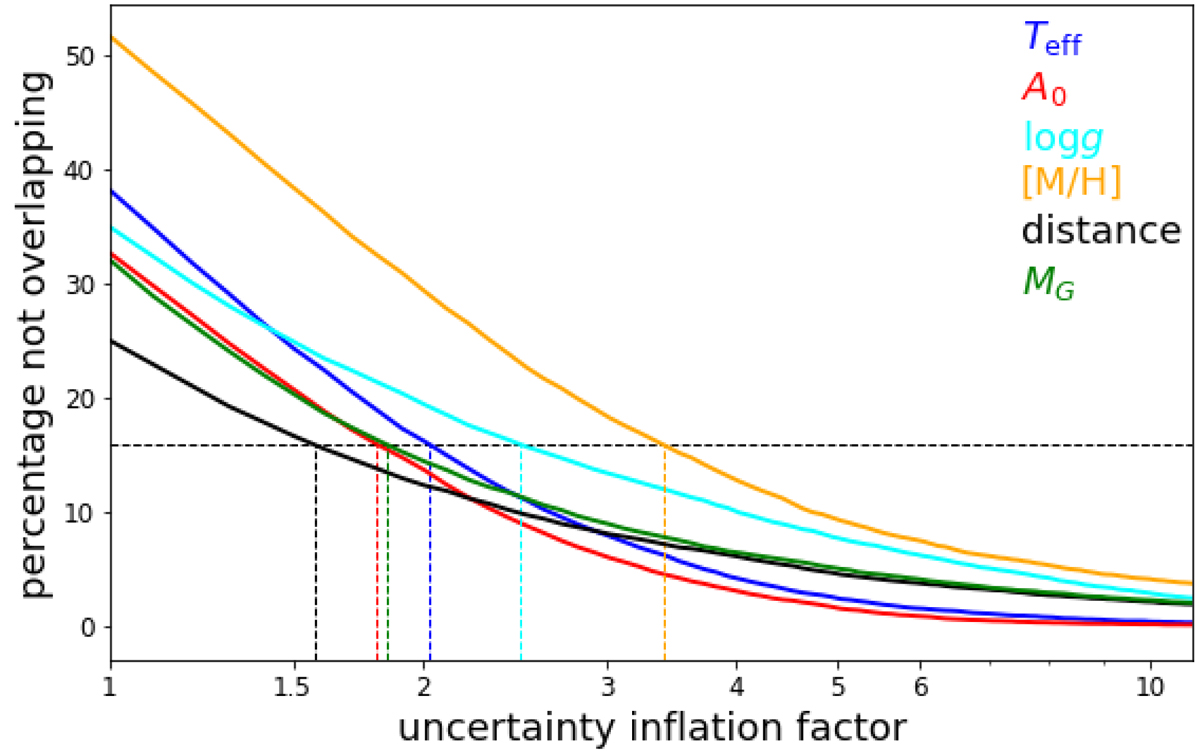
Fig. 18.
Download original image
Percentage of parameter pairs (in BP/RP split-epoch validation dataset) outside each other’s 68% confidence interval as a function of uncertainty inflation factor. The horizontal black dashed line at 16% shows the expected percentage if uncertainties were correctly estimated. Vertical colour dashed lines indicate the inflation factors necessary for each parameter in order to bring the percentage of non-overlapping intervals to the expected 16% level.
Current usage metrics show cumulative count of Article Views (full-text article views including HTML views, PDF and ePub downloads, according to the available data) and Abstracts Views on Vision4Press platform.
Data correspond to usage on the plateform after 2015. The current usage metrics is available 48-96 hours after online publication and is updated daily on week days.
Initial download of the metrics may take a while.