Fig. 14.
Download original image
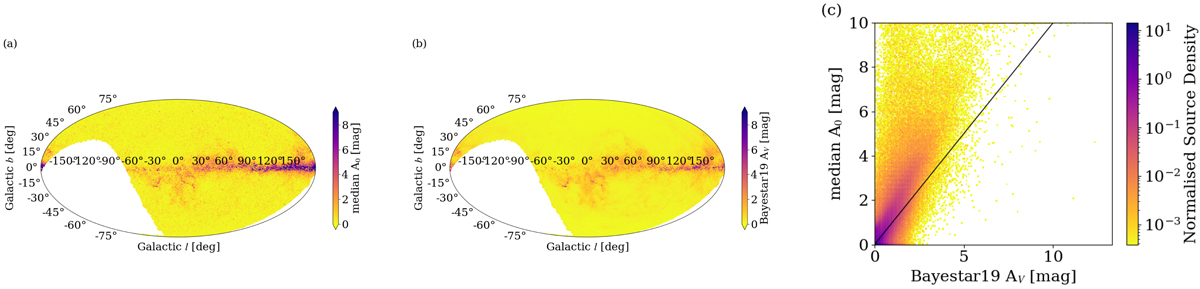
Extinction comparison between GSP-Phot and Bayestar19 for a randomly selected sample of 1 million sources. Panel (a): skymap of A0 provided by GSP-Phot, taking a pixel-wise median value. Panel (b): skymap of AV provided by Bayestar19, taking a pixel-wise median value. Panel (c): one-to-one comparison of the GSP-Phot median A0 and the Bayestar19 AV. Both skymaps use the Mollweide projection where lines of constant latitude are horizontal straight lines parallel to the equator. All panels show the identical sample of stars. The missing data in panels (a) and (b) are due to the footprint of Bayestar19.
Current usage metrics show cumulative count of Article Views (full-text article views including HTML views, PDF and ePub downloads, according to the available data) and Abstracts Views on Vision4Press platform.
Data correspond to usage on the plateform after 2015. The current usage metrics is available 48-96 hours after online publication and is updated daily on week days.
Initial download of the metrics may take a while.