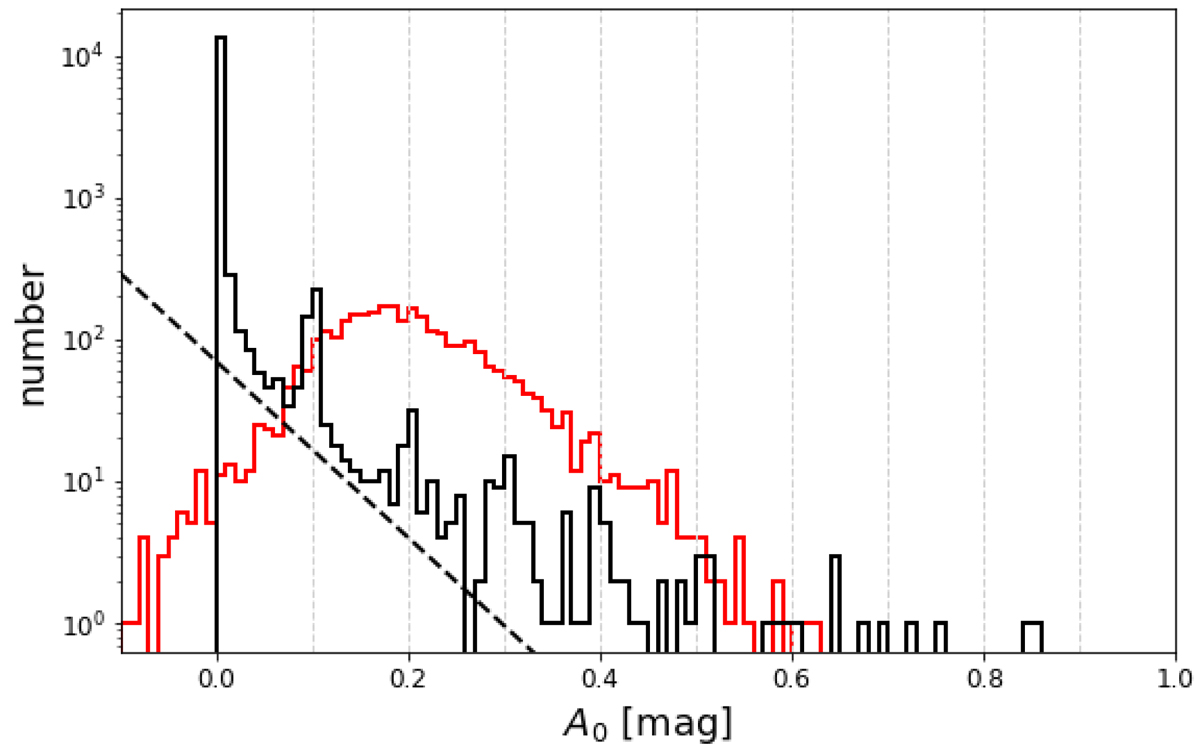
Fig. 12.
Download original image
Distribution of A0 estimates for stars in the Local Bubble (ϖ > 20 mas). The dashed black line indicates the slope of an exponential with 0.07 mag scale length. The vertical dashed grey lines indicate grid points of A0 from multilinear interpolation of model spectra (see Appendix B for the ADQL query.) The red histogram shows av50 extinction estimates from StarHorse2021 (Anders et al. 2022) with sh_outflag=0000.
Current usage metrics show cumulative count of Article Views (full-text article views including HTML views, PDF and ePub downloads, according to the available data) and Abstracts Views on Vision4Press platform.
Data correspond to usage on the plateform after 2015. The current usage metrics is available 48-96 hours after online publication and is updated daily on week days.
Initial download of the metrics may take a while.