Fig. 11.
Download original image
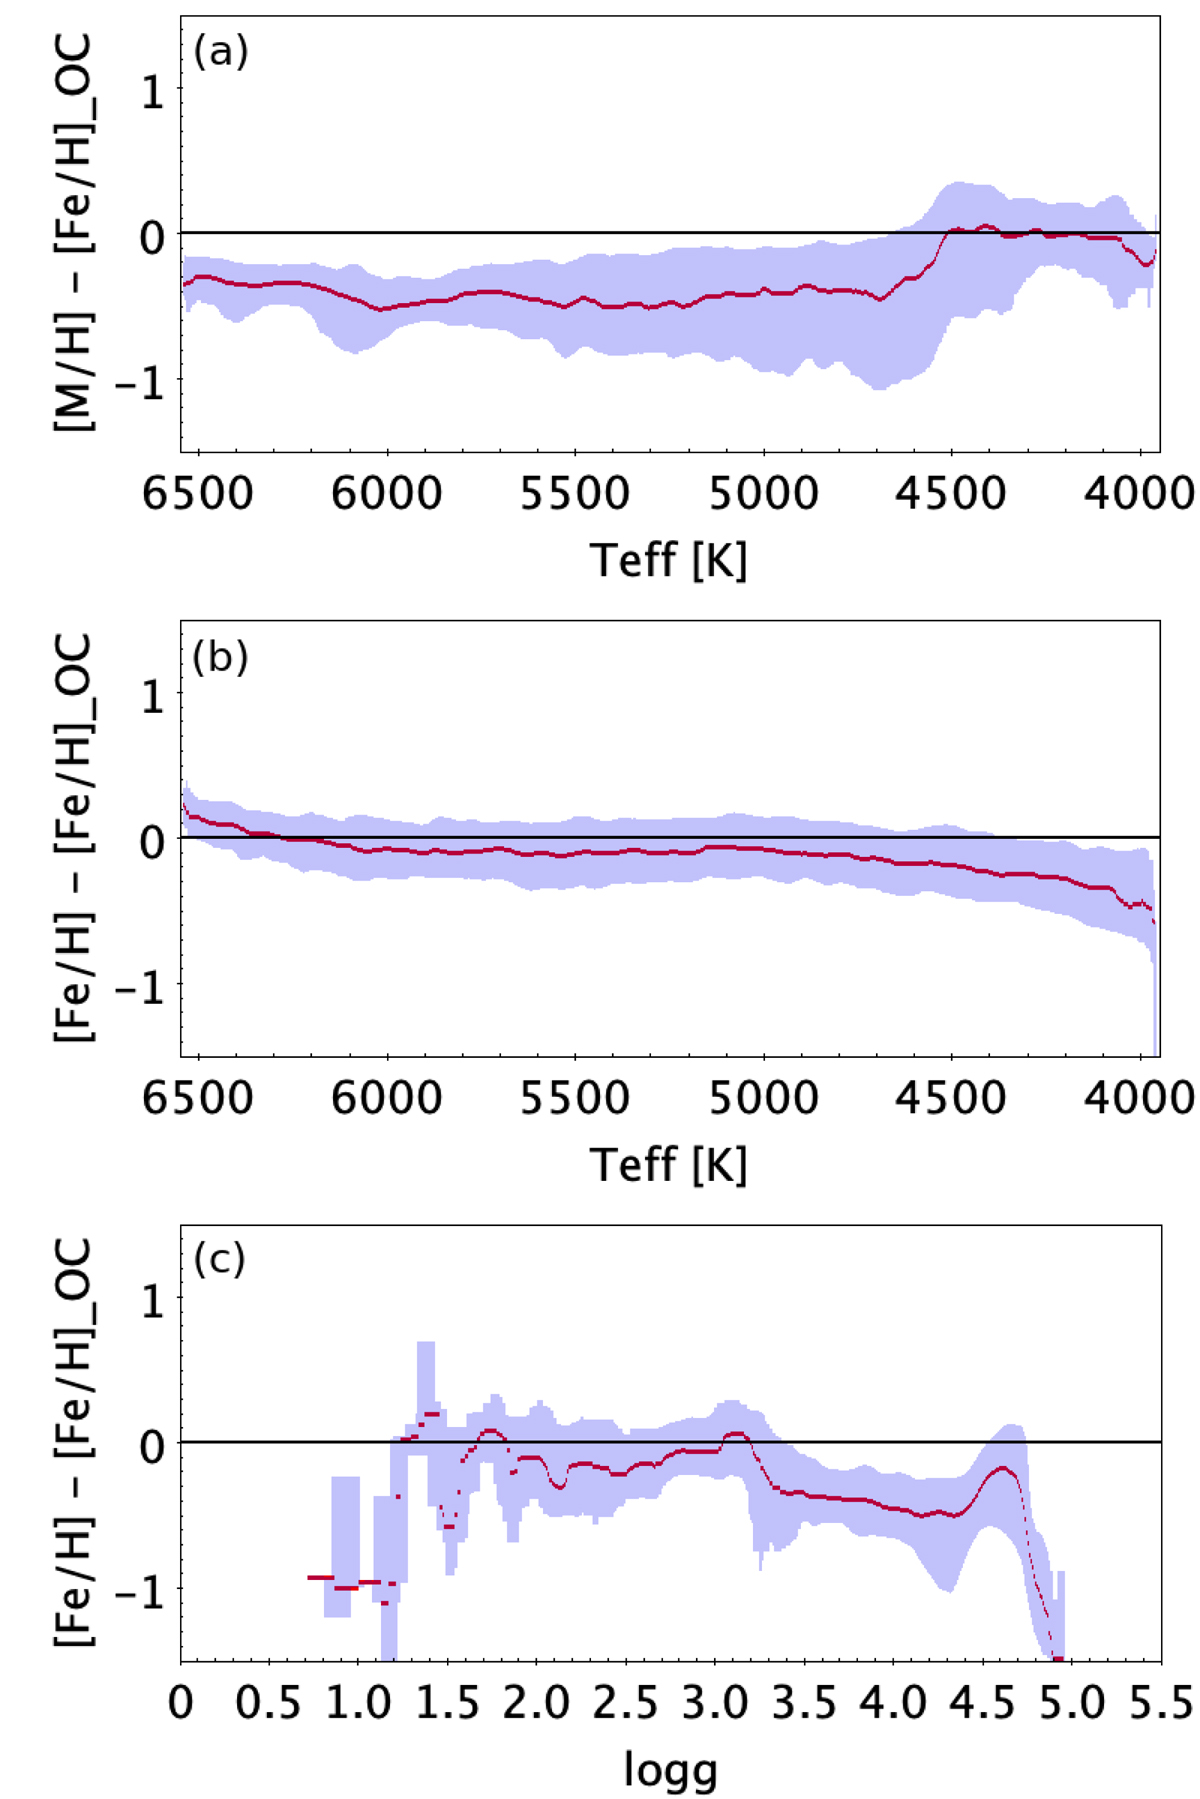
Difference between GSP-Phot metallicities of individual FGK members and the mean [Fe/H] of the parent open cluster for stars with ![]() and MARCS models, before and after the calibration. We note that the calibration on LAMOST [Fe/H] values translates [M/H] to [Fe/H]. The red line is the median of the distribution. The blue area is delimited by the 16th and 84th quantiles. Panel (a): residuals versus Teff before the calibration. Panel (b): residuals versus Teff after the calibration. Panel (c): residuals versus log g after the calibration.
and MARCS models, before and after the calibration. We note that the calibration on LAMOST [Fe/H] values translates [M/H] to [Fe/H]. The red line is the median of the distribution. The blue area is delimited by the 16th and 84th quantiles. Panel (a): residuals versus Teff before the calibration. Panel (b): residuals versus Teff after the calibration. Panel (c): residuals versus log g after the calibration.
Current usage metrics show cumulative count of Article Views (full-text article views including HTML views, PDF and ePub downloads, according to the available data) and Abstracts Views on Vision4Press platform.
Data correspond to usage on the plateform after 2015. The current usage metrics is available 48-96 hours after online publication and is updated daily on week days.
Initial download of the metrics may take a while.