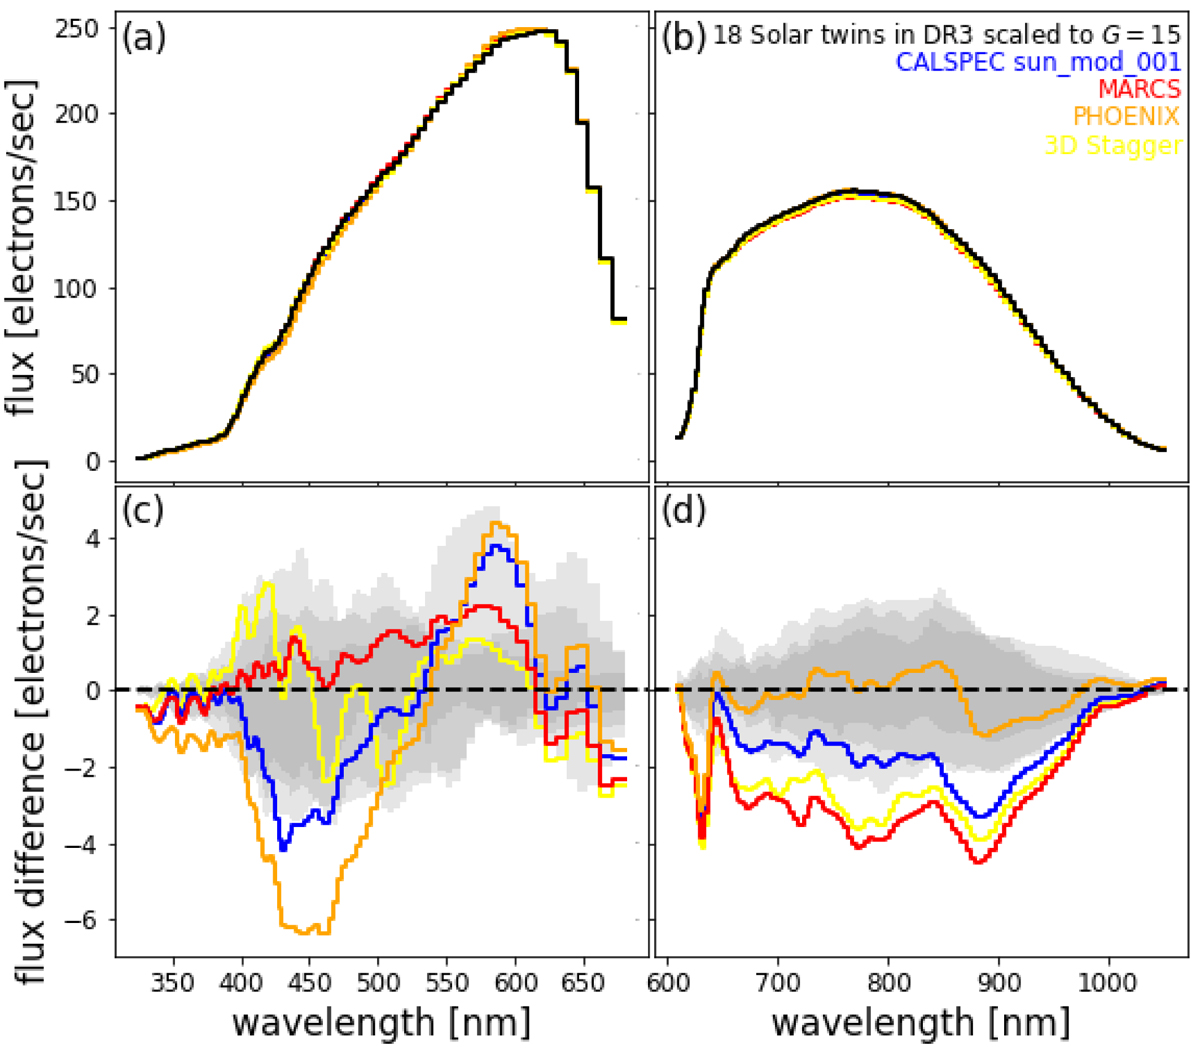
Fig. 1.
Download original image
Mismatch between observed BP/RP spectra of 18 solar twins from Galarza et al. (2021) with A0 < 0.001 mag (black lines and grey contours) and model BP/RP spectra from PHOENIX (orange lines), MARCS (red lines), CALSPEC sun_model_001 (blue lines), and 3D Stagger (yellow lines). Panel (a): all BP spectra scaled to G = 15. Panel (b): same as panel (a) but for RP. Panel (c): differences from median observed BP spectrum in panel (a). Panel (d): same as panel (c) but for RP. Grey contours in panels (c) and (d) indicate the pixel-wise central 68%, 90%, and min/max intervals given the 18 solar twins.
Current usage metrics show cumulative count of Article Views (full-text article views including HTML views, PDF and ePub downloads, according to the available data) and Abstracts Views on Vision4Press platform.
Data correspond to usage on the plateform after 2015. The current usage metrics is available 48-96 hours after online publication and is updated daily on week days.
Initial download of the metrics may take a while.