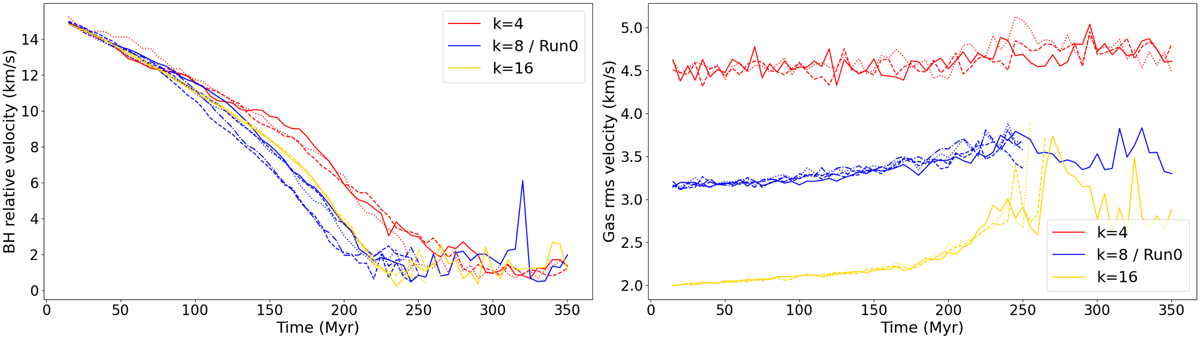
Fig. 9.
Download original image
Evolution with time of the BH relative velocity (left panel) and the gas rms velocity (right panel, excluding a sphere of radius 5 pc around the BH) for 3 different turbulent wavenumbers. Different linestyles of the same colour probe the stochastic variation of our results. Red curves show results for simulations k4, k4_TSeedA, and k4_TSeedB, blue curves show Run0, TSeedA, TSeedB, TSeedC, and TSeedD and yellow curves show k16, k16_TSeedA, and k16_TSeedB. Deceleration is slower at low wavenumbers, where, in our simulations, the rms velocity is higher, and plausibly transfer of kinetic energy from the BH to the gas less effective. Results are robust to stochastic variation of the turbulent density field.
Current usage metrics show cumulative count of Article Views (full-text article views including HTML views, PDF and ePub downloads, according to the available data) and Abstracts Views on Vision4Press platform.
Data correspond to usage on the plateform after 2015. The current usage metrics is available 48-96 hours after online publication and is updated daily on week days.
Initial download of the metrics may take a while.