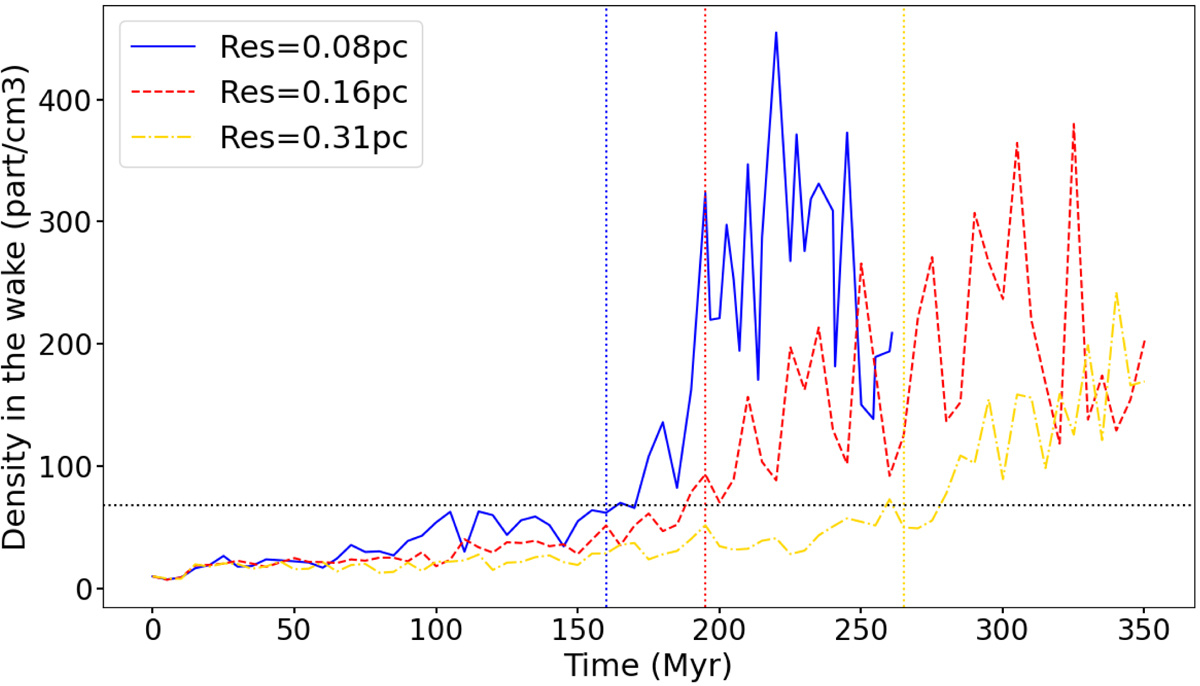
Fig. 8.
Download original image
Evolution of the density in the wake as a function of time for three different resolutions. The dotted vertical lines of the associated colours show the time of the transition from supersonic to subsonic regime in each case. At higher resolution the density in the wake increases faster, but stalls at similar values when the BH reaches ℳ = 1. The horizontal line shows the mean density in the wake at the time of the transition from supersonic to subsonic regime.
Current usage metrics show cumulative count of Article Views (full-text article views including HTML views, PDF and ePub downloads, according to the available data) and Abstracts Views on Vision4Press platform.
Data correspond to usage on the plateform after 2015. The current usage metrics is available 48-96 hours after online publication and is updated daily on week days.
Initial download of the metrics may take a while.