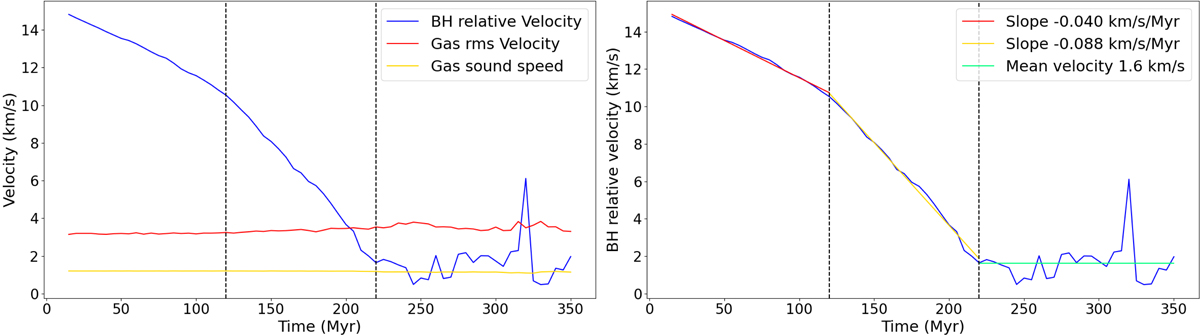
Fig. 4.
Download original image
Run0 velocities evolution. Left: evolution of the BH relative velocity (blue), the gas effective velocity (red, excluding a sphere of radius 5 pc around the BH), and sound speed (yellow) over time for Run0. Right: evolution of the BH relative velocity with superimposed fits to its time evolution. The dashed vertical lines in both panels mark the three phases of the BH deceleration. In the first phase the BHL radius is not well resolved, in the second the BHL radius is well resolved and deceleration is stronger, in the third the BH is in the transonic regime and does not decelerate further.
Current usage metrics show cumulative count of Article Views (full-text article views including HTML views, PDF and ePub downloads, according to the available data) and Abstracts Views on Vision4Press platform.
Data correspond to usage on the plateform after 2015. The current usage metrics is available 48-96 hours after online publication and is updated daily on week days.
Initial download of the metrics may take a while.