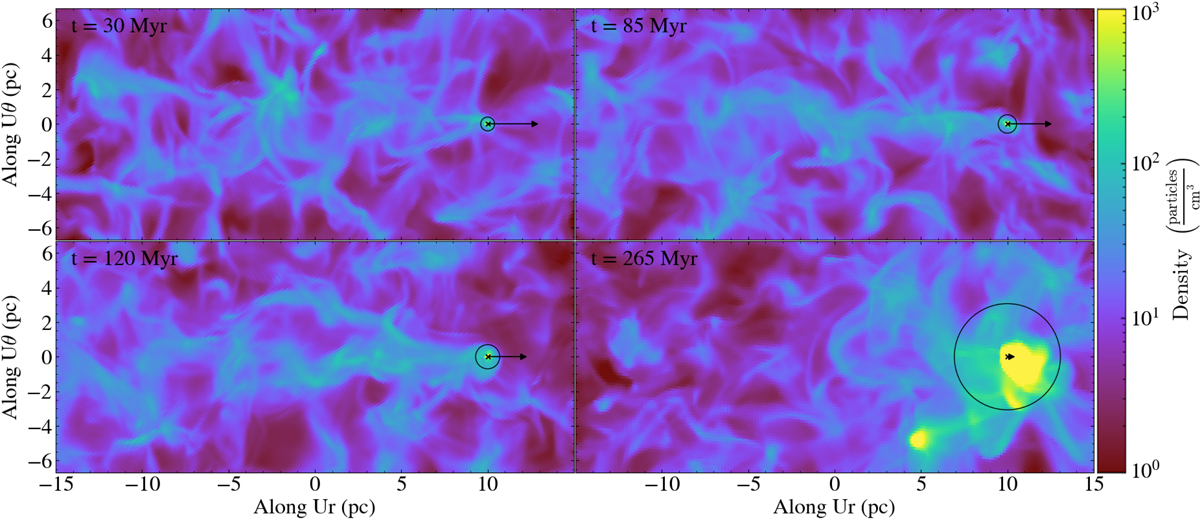
Fig. 3.
Download original image
BH wake evolution in Run0. The gas density is projected over a width of 5 pc at times t = 30 (top left), 85 (top right), and 120 (bottom left) Myr for the supersonic regime, and 265 Myr (bottom right) for the transonic regime. Images are displayed along the velocity vector of the BH (Ur). The cross marks the BH position, the circle shows the size of the BHL radius, and the length of the black arrow is proportional to the BH velocity. The images are oriented such that the BH velocity vector, and hence the gas wake as well, is contained in the plane of the image, with the gas wake on the left-hand side of the BH position.
Current usage metrics show cumulative count of Article Views (full-text article views including HTML views, PDF and ePub downloads, according to the available data) and Abstracts Views on Vision4Press platform.
Data correspond to usage on the plateform after 2015. The current usage metrics is available 48-96 hours after online publication and is updated daily on week days.
Initial download of the metrics may take a while.