Open Access
Fig. 2.
Download original image
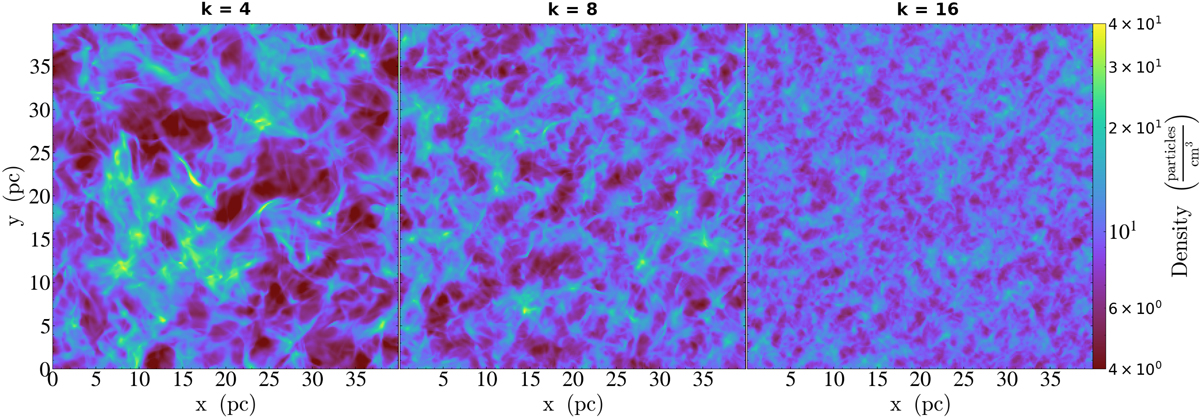
Projection of the gas density. This at time t = 10 Myr, before the BH injection, for various turbulence wavenumbers: k = 4 (left panel, k4 simulation), k = 8 (middle panel, Run0 simulation), and k = 16 (right panel, k16 simulation).
Current usage metrics show cumulative count of Article Views (full-text article views including HTML views, PDF and ePub downloads, according to the available data) and Abstracts Views on Vision4Press platform.
Data correspond to usage on the plateform after 2015. The current usage metrics is available 48-96 hours after online publication and is updated daily on week days.
Initial download of the metrics may take a while.