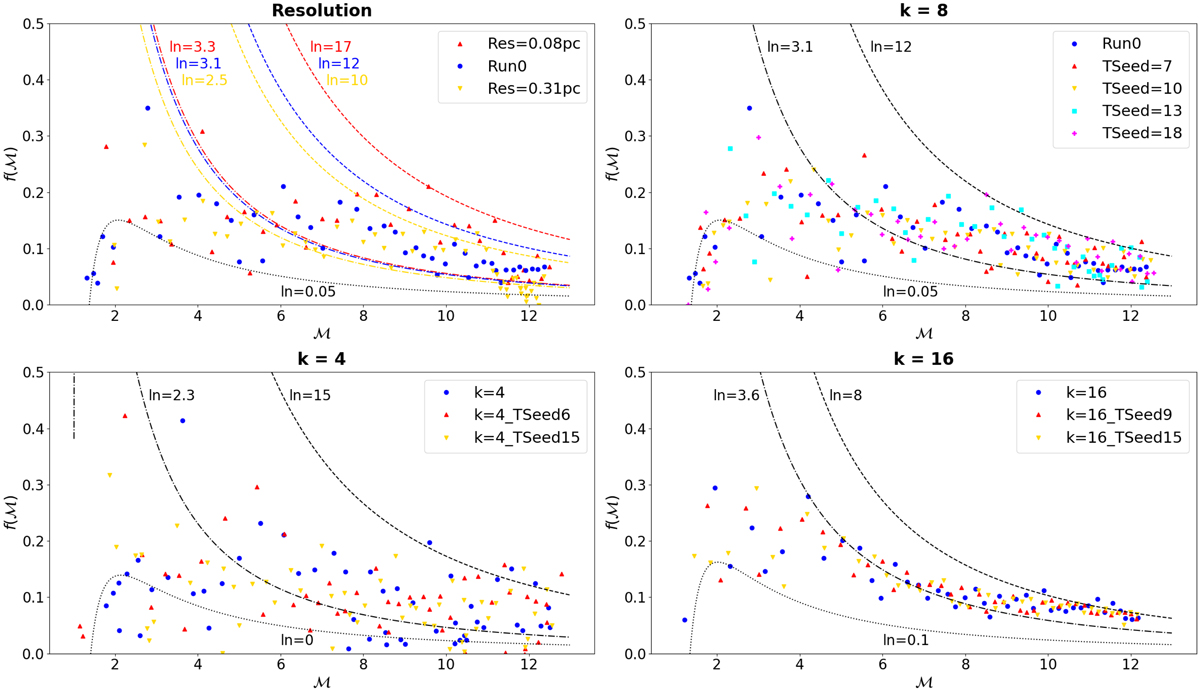
Fig. 11.
Download original image
Magnitude of the dimensionless drag force f(ℳ) as defined in Eq. (6) is shown as a function of Mach number ℳ. Top left: resolution study for k = 8. Top right to bottom left (clockwise): simulations with k = 8, k = 16, and k = 4 respectively, all with resolution 0.16 pc and different turbulent seeds shown as different colours. The curves represent Eq. (6) for different values of ln(rmax/rmin): the dotted curves envelope the lower points with a minimum ln(rmax/rmin), the dashed curves envelope the upper points with a maximum ln(rmax/rmin), and the dash-dotted lines are a fit for ℳ > 4. The corresponding values of ln(rmax/rmin) are given on the plots. The main impact of ℳ on f(ℳ) is not a variation in the magnitude of f(ℳ) but an increase in its scatter for decreasing ℳ. At high wavenumber, when we are closer to the homogeneous case, the magnitude of f(ℳ) varies more with ℳ, while in the least homogeneous case (k = 4) scatter dominates at all ℳ.
Current usage metrics show cumulative count of Article Views (full-text article views including HTML views, PDF and ePub downloads, according to the available data) and Abstracts Views on Vision4Press platform.
Data correspond to usage on the plateform after 2015. The current usage metrics is available 48-96 hours after online publication and is updated daily on week days.
Initial download of the metrics may take a while.