Fig. 9.
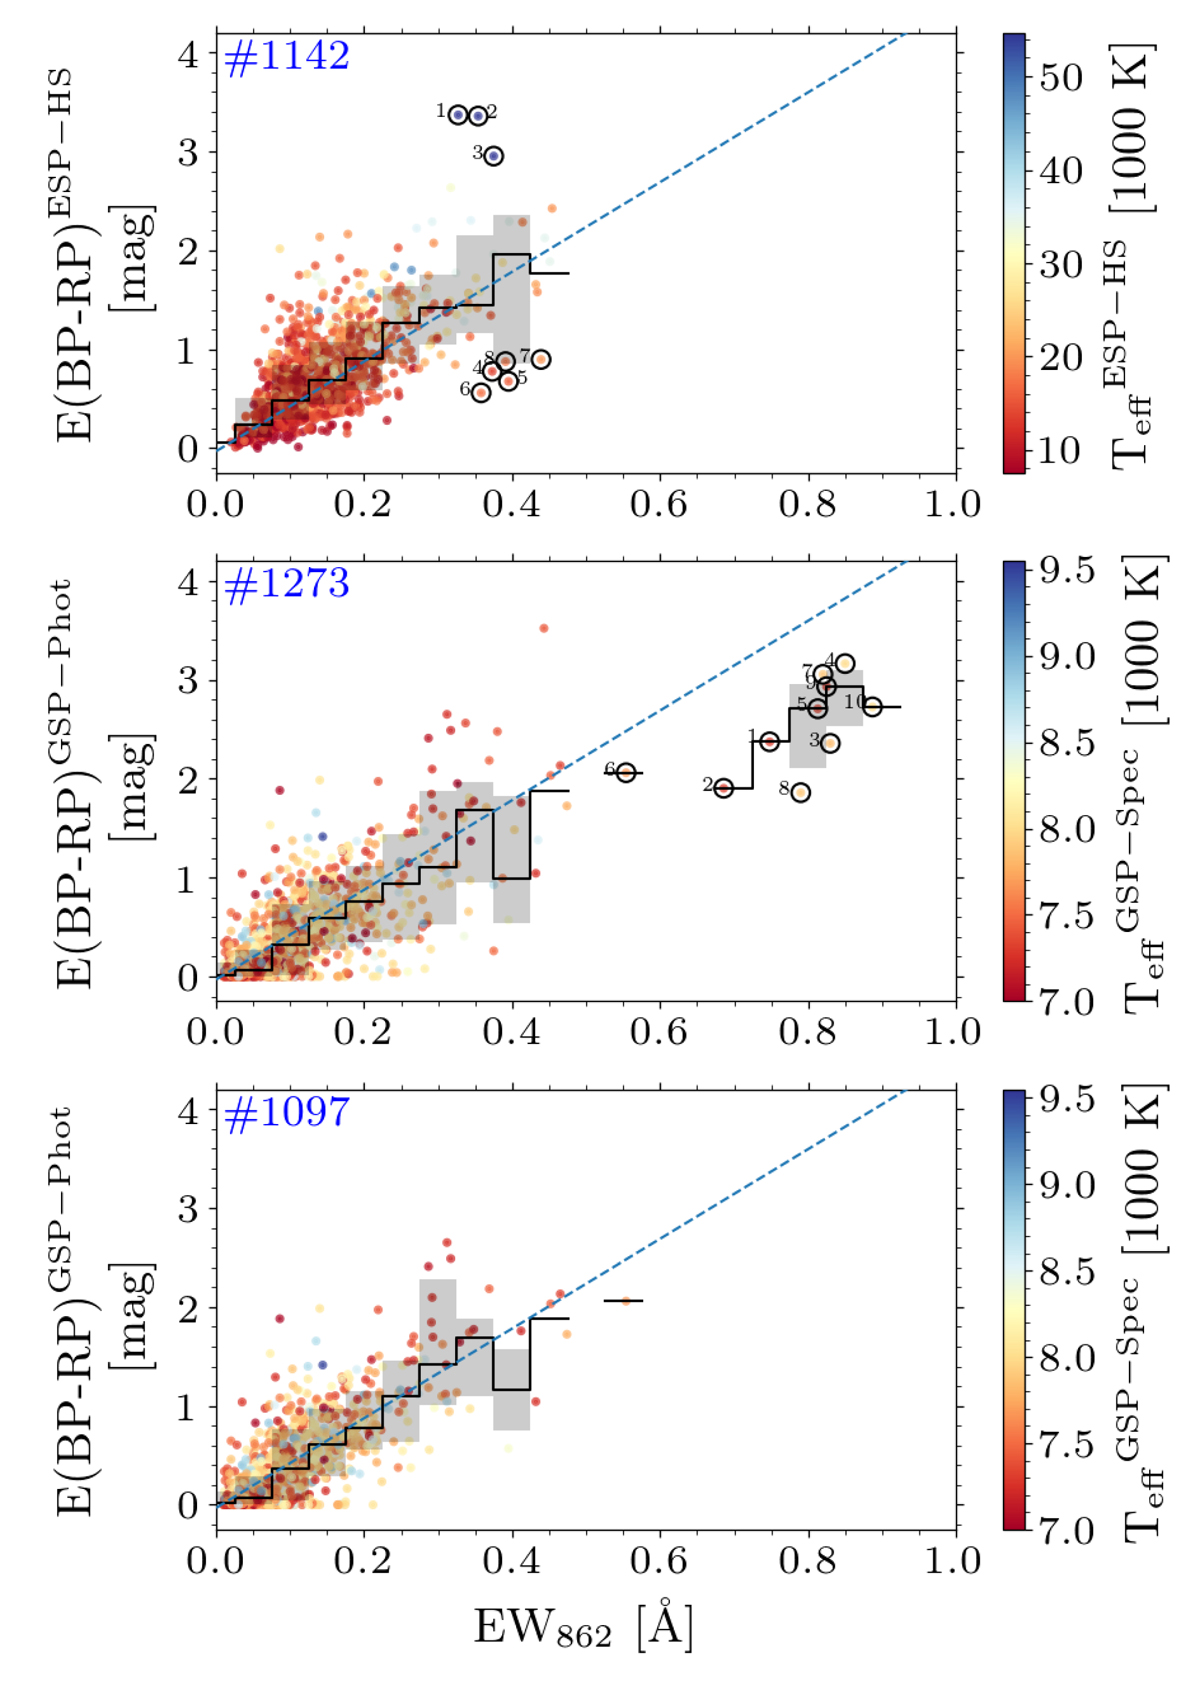
Download original image
E(BP−RP) vs. EW862 of the DIB λ862 derived for the HQ sample by GSP-Spec for hot stars. The colour code follows the effective temperature derived by ESP-HS or GSP-Spec. The running median and interquantile (15–85%) are represented by a black step curve and the shaded area, respectively. The relation derived for the cooler stars is shown by the broken blue line. Upper panel: reddening derived using the ESP-HS module for stars hotter than 7500 K. The outliers are identified with black circles and numbers. Middle panel: E(BP−RP) from GSP-Phot for targets hotter than 7000 K according to GSP-Spec only. Lower panel: E(BP−RP) from GSP-Phot, and hotter than 7000 K according GSP-Spec and GSP-Phot. Numbered black circles denote the outliers which are discussed in the main text, with their parameters listed in Table C.1.
Current usage metrics show cumulative count of Article Views (full-text article views including HTML views, PDF and ePub downloads, according to the available data) and Abstracts Views on Vision4Press platform.
Data correspond to usage on the plateform after 2015. The current usage metrics is available 48-96 hours after online publication and is updated daily on week days.
Initial download of the metrics may take a while.