Fig. 8.
Download original image
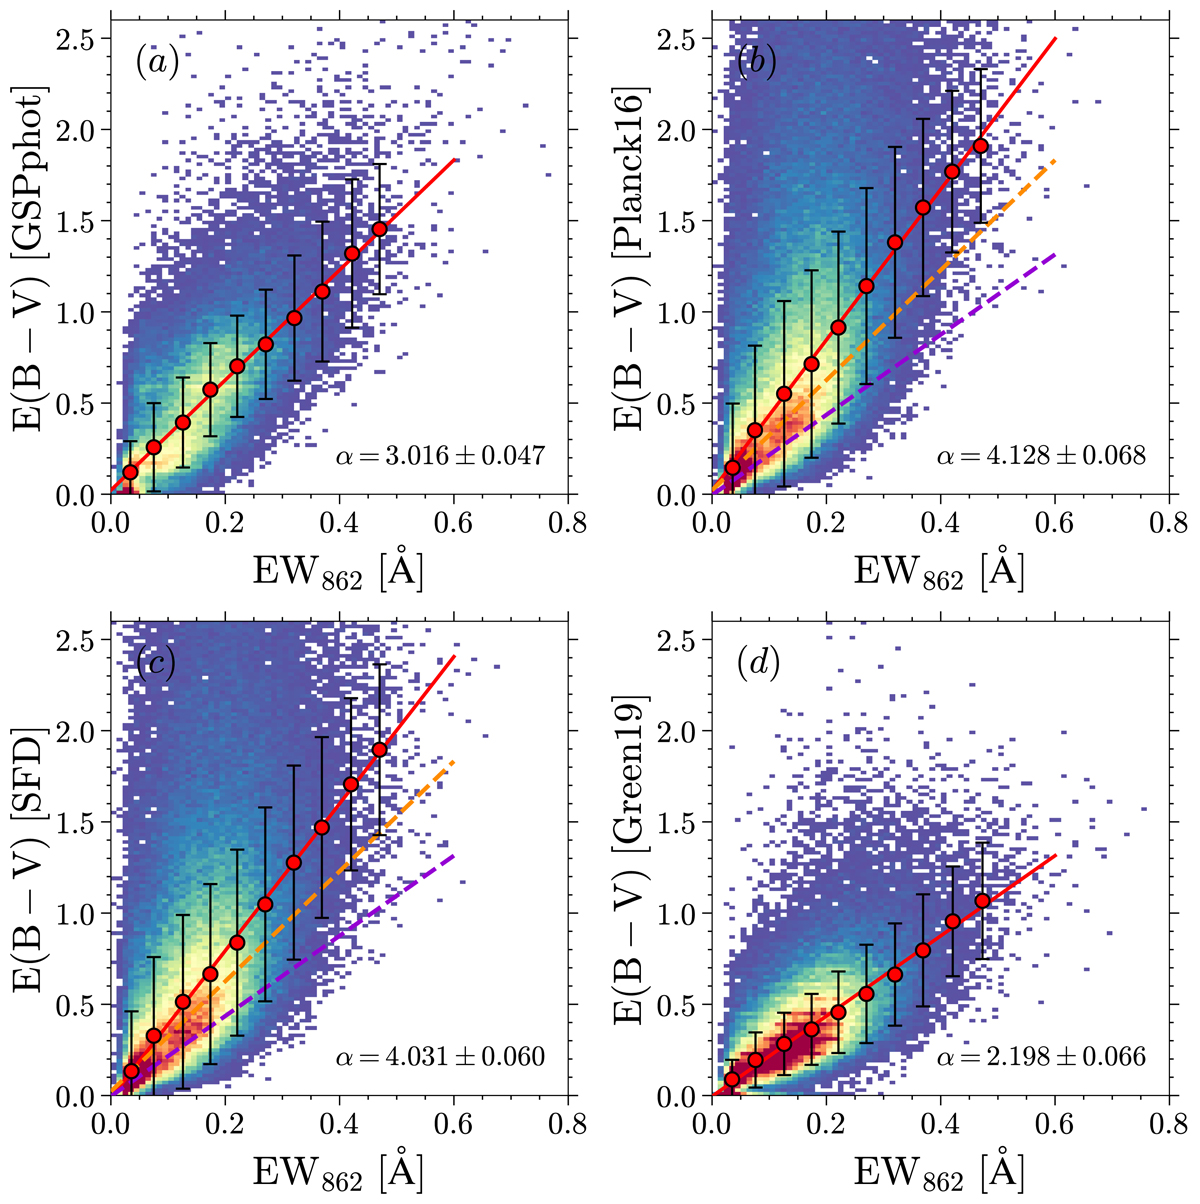
Correlations between EW862 and E(B − V) derived from different extinction maps: (a) GSP-Phot, (b) Planck Collaboration Int. XLVIII (2016), (c) Schlegel et al. (1998), and (d) Green et al. (2019). The colours in each panel show the target number per 0.01 Å × 0.02 mag bin. The colour bar is the same as in Fig. 7. The red circles are the median values taken in EW862 bins from 0 to 0.5 Å with a step of 0.05 Å. The red lines are linear fits to the red dots in each panel, respectively. The fitting gradients (α) and their uncertainties are indicated. They are also listed in Table 3. The orange and violet dashed lines in (b) and (c) are the fit results to GSP-Phot and Green et al. (2019), respectively.
Current usage metrics show cumulative count of Article Views (full-text article views including HTML views, PDF and ePub downloads, according to the available data) and Abstracts Views on Vision4Press platform.
Data correspond to usage on the plateform after 2015. The current usage metrics is available 48-96 hours after online publication and is updated daily on week days.
Initial download of the metrics may take a while.