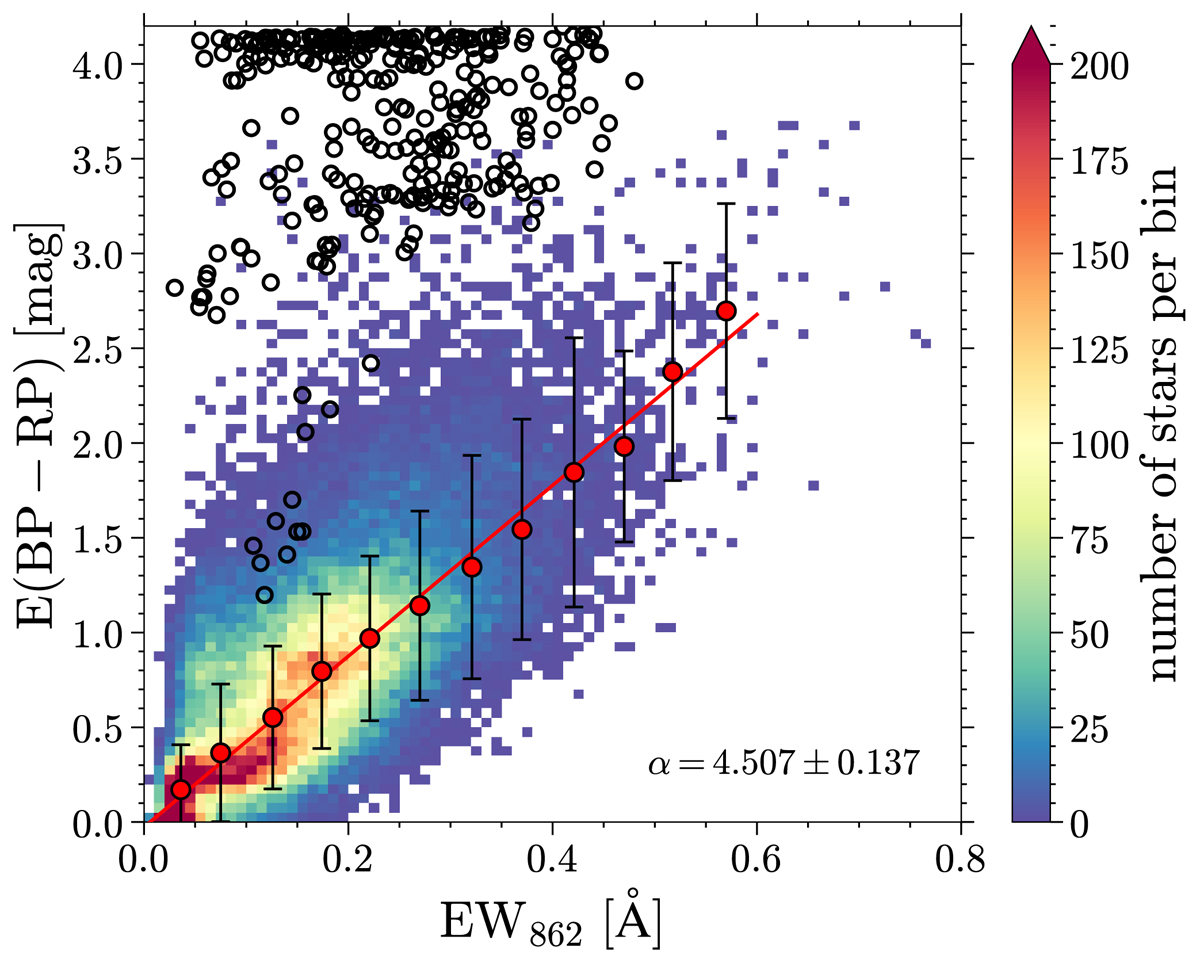
Fig. 7.
Download original image
Correlation between EW862 and E(BP−RP) for 55 557 measurements in the high-quality sample with E(BP−RP) values. The colour scale shows the number of stars per 0.01 Å × 0.05 mag bin. The red dots are the median values taken in EW862 bins from 0 to 0.6 Å with a step of 0.05 Å. The red line is the linear fit to the red dots. The fitting gradient and its uncertainty are also indicated. The open black circles (305 in total) are sources with a temperature difference (GSP-Phot – GSP-Spec) larger than 5000 K.
Current usage metrics show cumulative count of Article Views (full-text article views including HTML views, PDF and ePub downloads, according to the available data) and Abstracts Views on Vision4Press platform.
Data correspond to usage on the plateform after 2015. The current usage metrics is available 48-96 hours after online publication and is updated daily on week days.
Initial download of the metrics may take a while.