Fig. 17.
Download original image
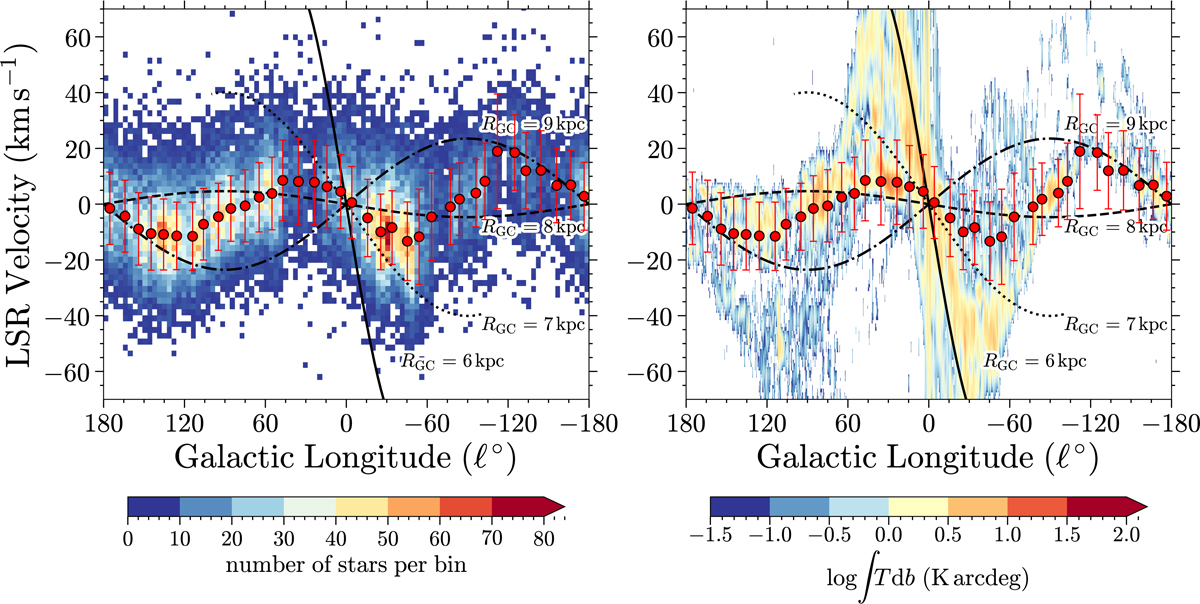
Left panel: longitude–velocity diagram for the Gaia HQ DIB λ862 sample. The circles indicate the median VLSR and standard uncertainty of the mean for each field. Velocity curves calculated by Model A5 in Reid et al. (2019) for different galactocentric distances (RGC) are overplotted. Right panel: same as left panel but superimposed on the 12CO data from Dame et al. (2001). The colour-scale displays the 12CO brightness temperature in a logarithmic scale integrated over the velocity range.
Current usage metrics show cumulative count of Article Views (full-text article views including HTML views, PDF and ePub downloads, according to the available data) and Abstracts Views on Vision4Press platform.
Data correspond to usage on the plateform after 2015. The current usage metrics is available 48-96 hours after online publication and is updated daily on week days.
Initial download of the metrics may take a while.