Fig. 15.
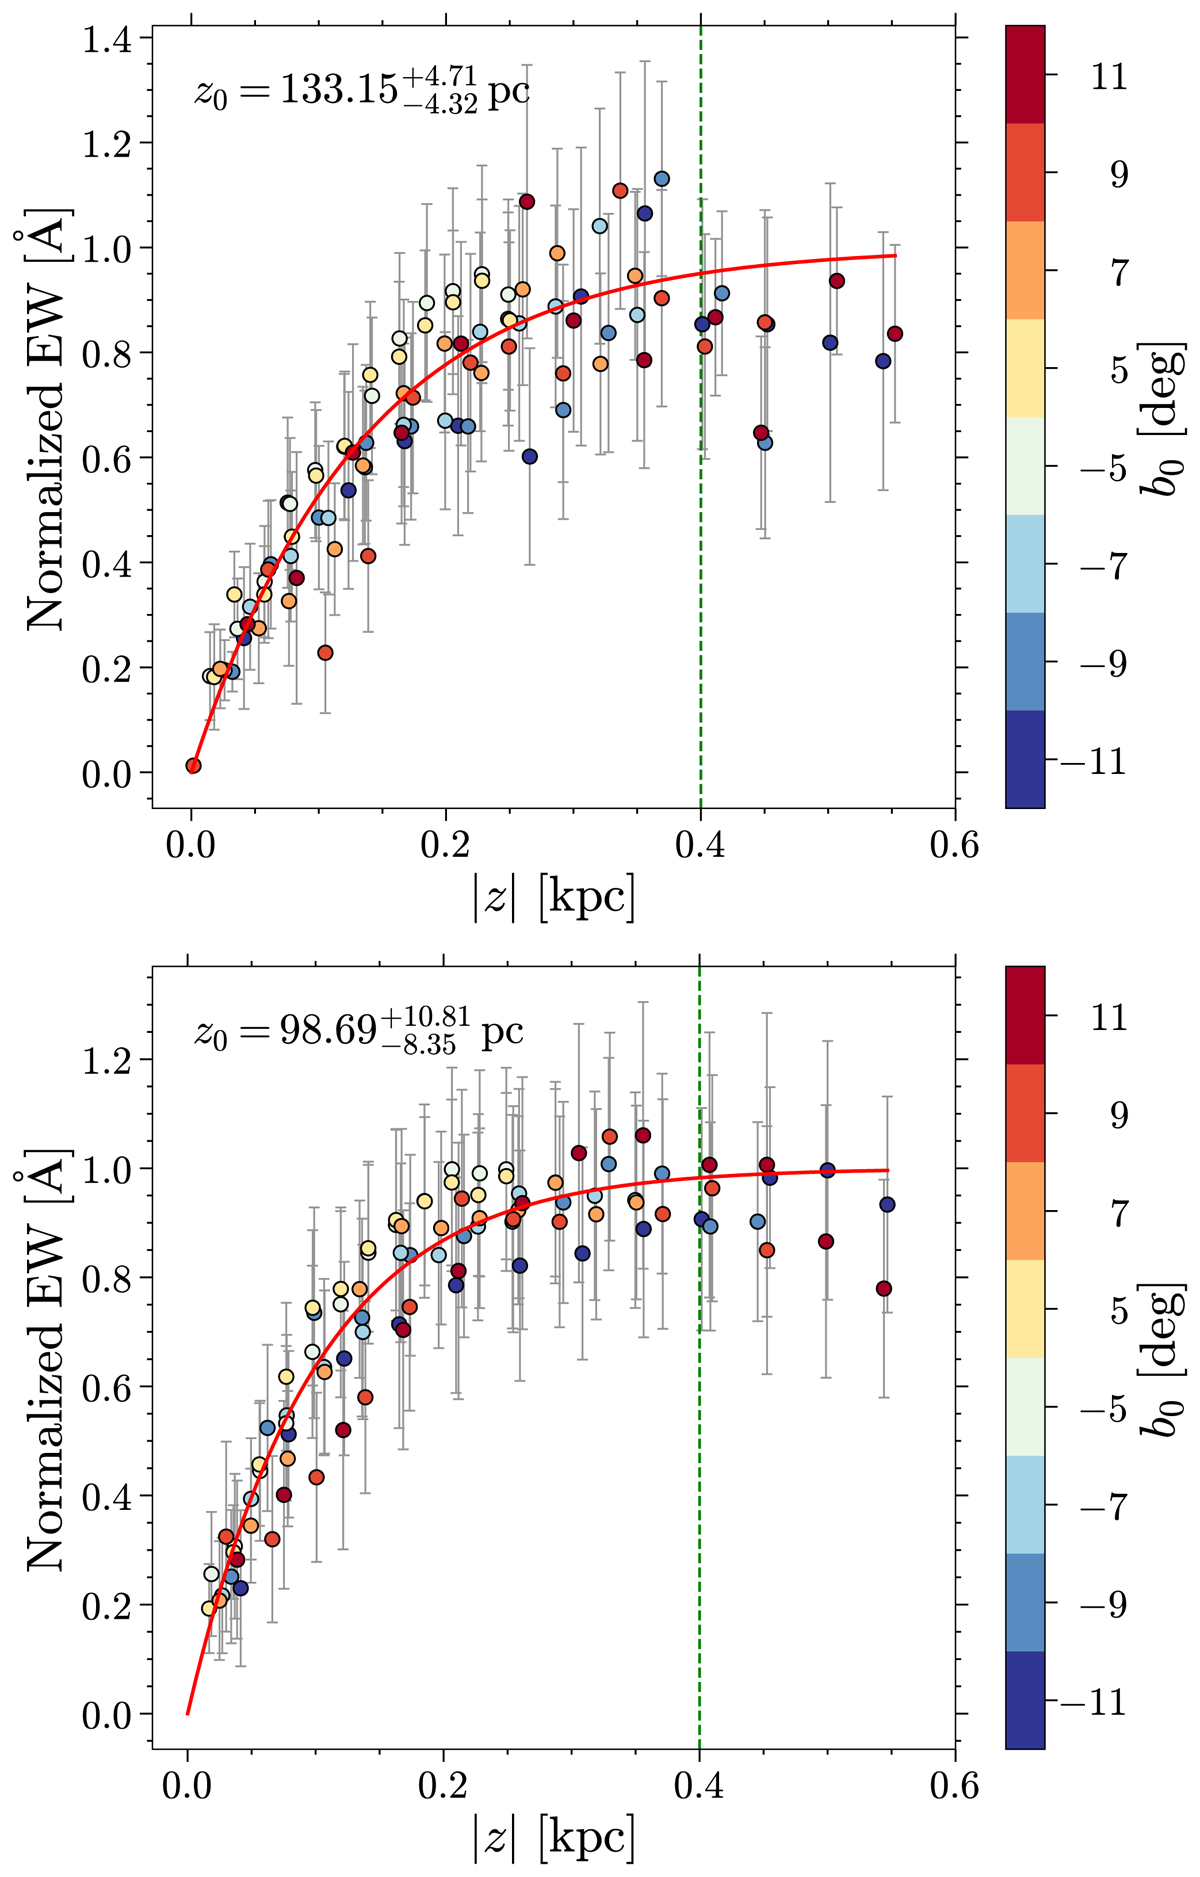
Download original image
Determination of the scale height of the λ862 carrier by the DIB measurements with 4° ⩽|b|⩽12°, and upper panel: 240° ⩽ℓ⩽330°; lower panel: toward all available longitude directions, respectively. The data points at different latitude slabs are coloured according to the central latitude values (b0). The dashed green line indicates z = 0.4 kpc. The red curve in the upper panel is the fit to data points with z ⩽ 0.4 kpc, while in the lower panel, the red curve is the fit to all the data points.
Current usage metrics show cumulative count of Article Views (full-text article views including HTML views, PDF and ePub downloads, according to the available data) and Abstracts Views on Vision4Press platform.
Data correspond to usage on the plateform after 2015. The current usage metrics is available 48-96 hours after online publication and is updated daily on week days.
Initial download of the metrics may take a while.