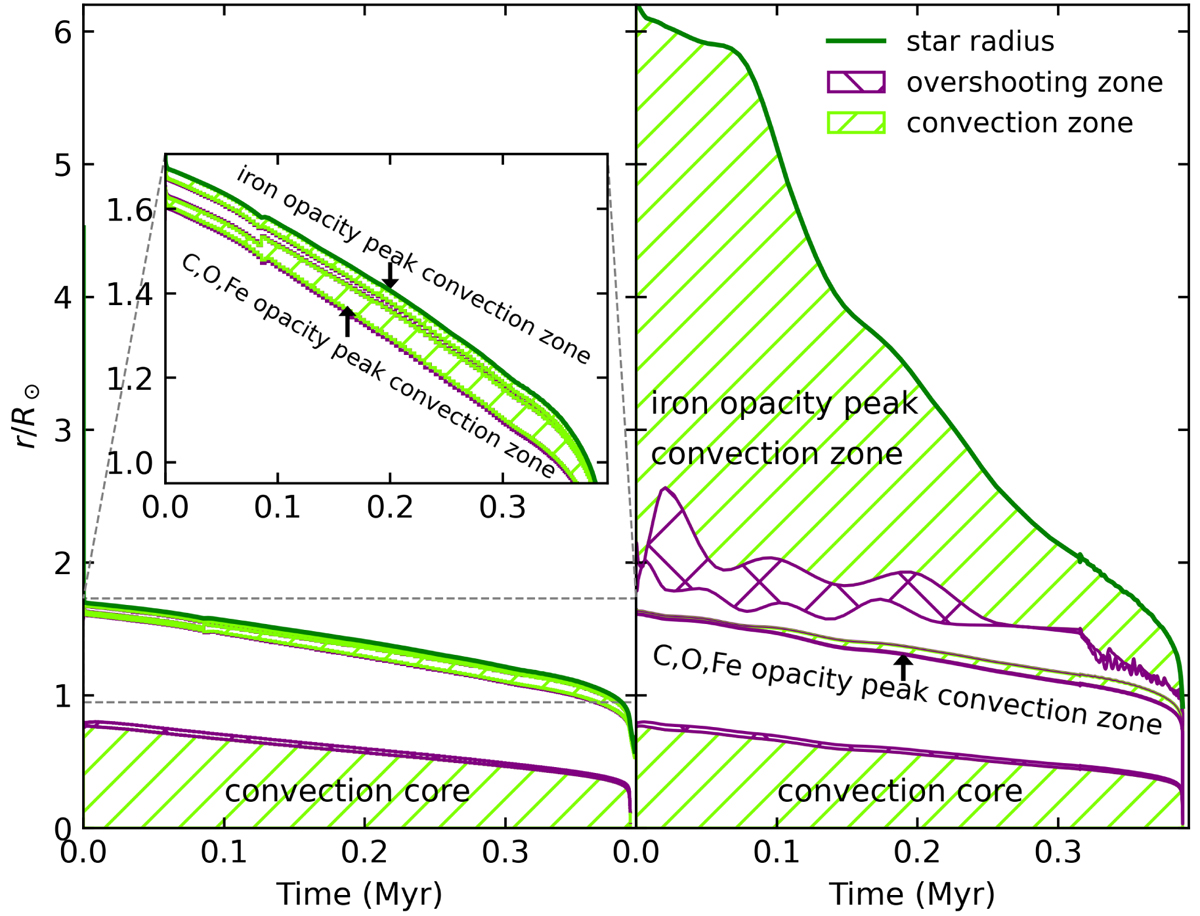
Fig. 3.
Download original image
Structure evolution (Kippenhahn) diagrams. The x-axis shows evolutionary time (unit: million years; zero point: HeZAMS), and the y-axis represents the radius. The left and right panels show the 30 M⊙ He star with and without MLT++ prescription, respectively. The green-shaded and purple-shaded regions indicate the convection zone and overshooting zone, respectively.
Current usage metrics show cumulative count of Article Views (full-text article views including HTML views, PDF and ePub downloads, according to the available data) and Abstracts Views on Vision4Press platform.
Data correspond to usage on the plateform after 2015. The current usage metrics is available 48-96 hours after online publication and is updated daily on week days.
Initial download of the metrics may take a while.