Fig. 2.
Download original image
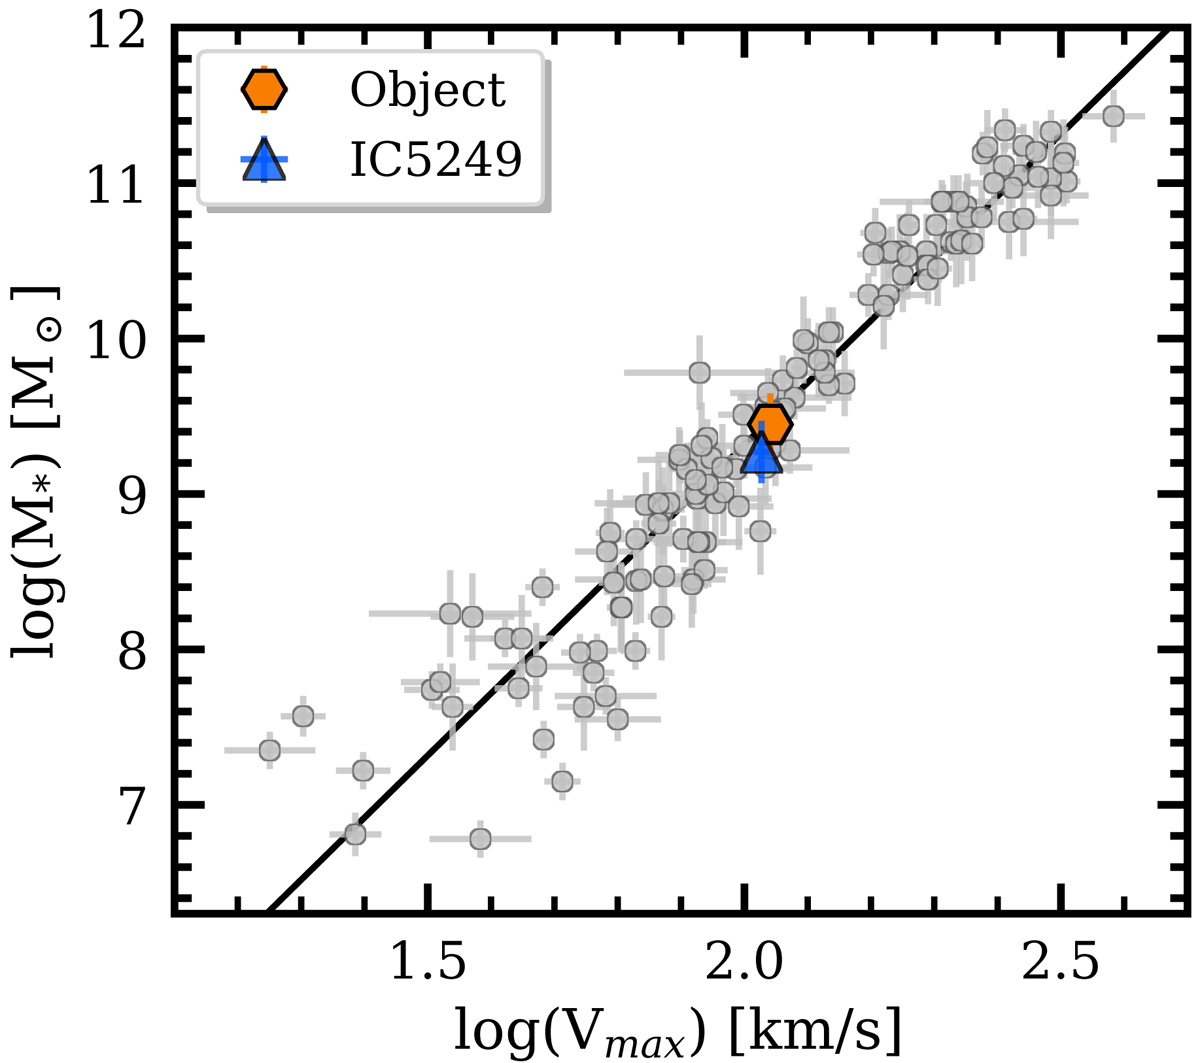
Tully–Fisher relation from Lelli et al. (2019, gray points with error bars) with the stellar masses from Lelli et al. (2016). This rendering represents stellar mass vs. maximum rotational velocity. The figure also includes the object (orange hexagon; M⋆ = 2.8 × 10⁹ M⊙, Vmax = 110 km s−1) and the galaxy IC 5249 (blue triangle; M⋆ = 1.9 × 10⁹ M⊙, Vmax = 106 km s−1). Both objects lie close to each other and precisely on the relation. The solid black line is a linear fit to the gray points of the form log M⋆ = A × log Vmax + B, with A = 4.0 ± 0.1 and B = 1.3 ± 0.2.
Current usage metrics show cumulative count of Article Views (full-text article views including HTML views, PDF and ePub downloads, according to the available data) and Abstracts Views on Vision4Press platform.
Data correspond to usage on the plateform after 2015. The current usage metrics is available 48-96 hours after online publication and is updated daily on week days.
Initial download of the metrics may take a while.