Open Access
Fig. A.2.
Download original image
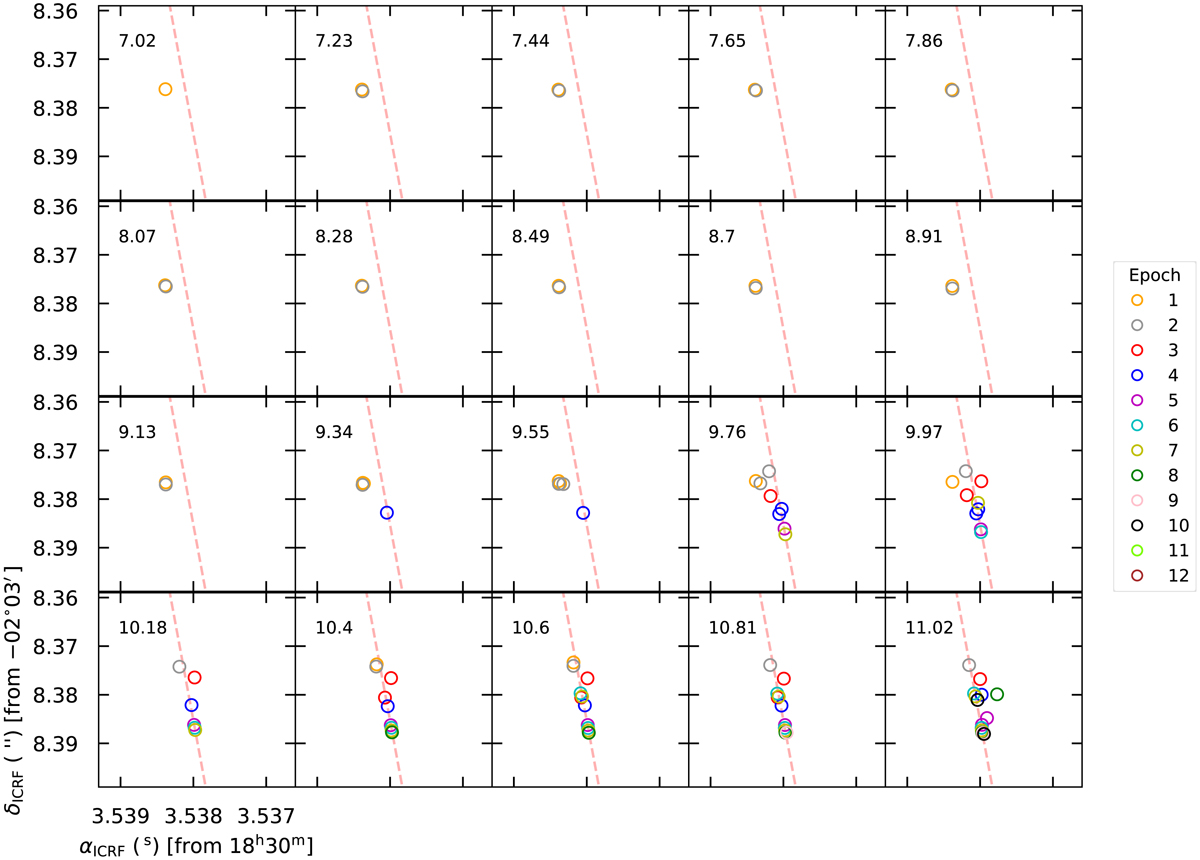
Spatial distribution of the water maser spots. The parallax signature has been subtracted from all positions presented here. The numbers in the corners indicate the velocity channel in km s−1. The symbols are color-coded by epoch (see the figure legend).
Current usage metrics show cumulative count of Article Views (full-text article views including HTML views, PDF and ePub downloads, according to the available data) and Abstracts Views on Vision4Press platform.
Data correspond to usage on the plateform after 2015. The current usage metrics is available 48-96 hours after online publication and is updated daily on week days.
Initial download of the metrics may take a while.