Fig. 3.
Download original image
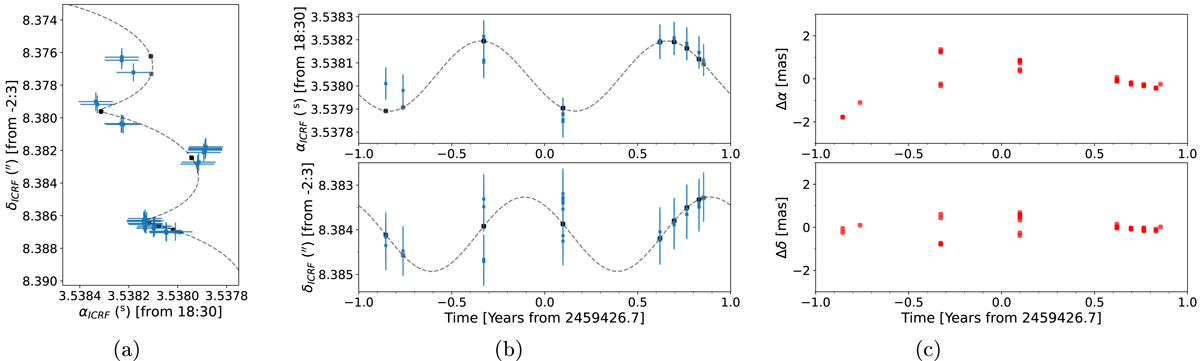
Astrometric fits to water maser spots detected in the velocity range VLSR = 9.76–10.81 km s−1. (a) Measured absolute spot positions, shown as blue squares. The dashed black line is the fitted model. Expected positions from the best-fit model are shown as black dots. (b) Measured positions and best-fit model after proper motions are removed. (c) Residuals of the astrometric fit in RA (top panel) and Dec (bottom panel).
Current usage metrics show cumulative count of Article Views (full-text article views including HTML views, PDF and ePub downloads, according to the available data) and Abstracts Views on Vision4Press platform.
Data correspond to usage on the plateform after 2015. The current usage metrics is available 48-96 hours after online publication and is updated daily on week days.
Initial download of the metrics may take a while.