Open Access
Fig. C.1.
Download original image
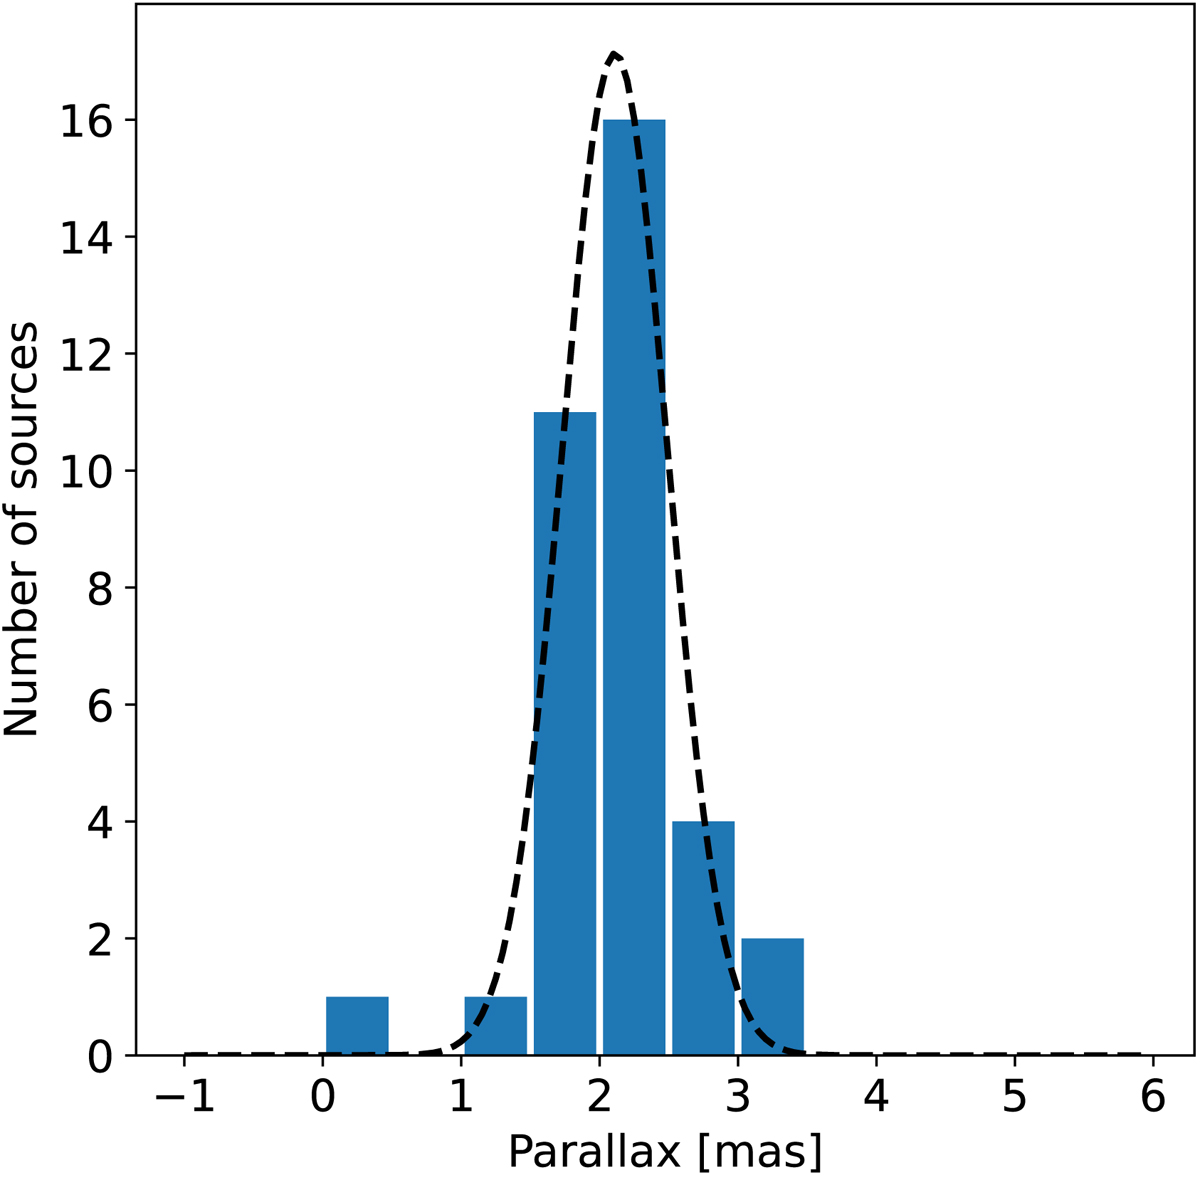
Distribution of Gaia DR3 parallaxes for the sample of YSOs selected from the catalogs published by Dunham et al. (2015) and Anderson et al. (2022) and that satisfy the criteria listed in Sect. C. The dashed black line is a Gaussian fit to the distribution.
Current usage metrics show cumulative count of Article Views (full-text article views including HTML views, PDF and ePub downloads, according to the available data) and Abstracts Views on Vision4Press platform.
Data correspond to usage on the plateform after 2015. The current usage metrics is available 48-96 hours after online publication and is updated daily on week days.
Initial download of the metrics may take a while.