Fig. 3
Download original image
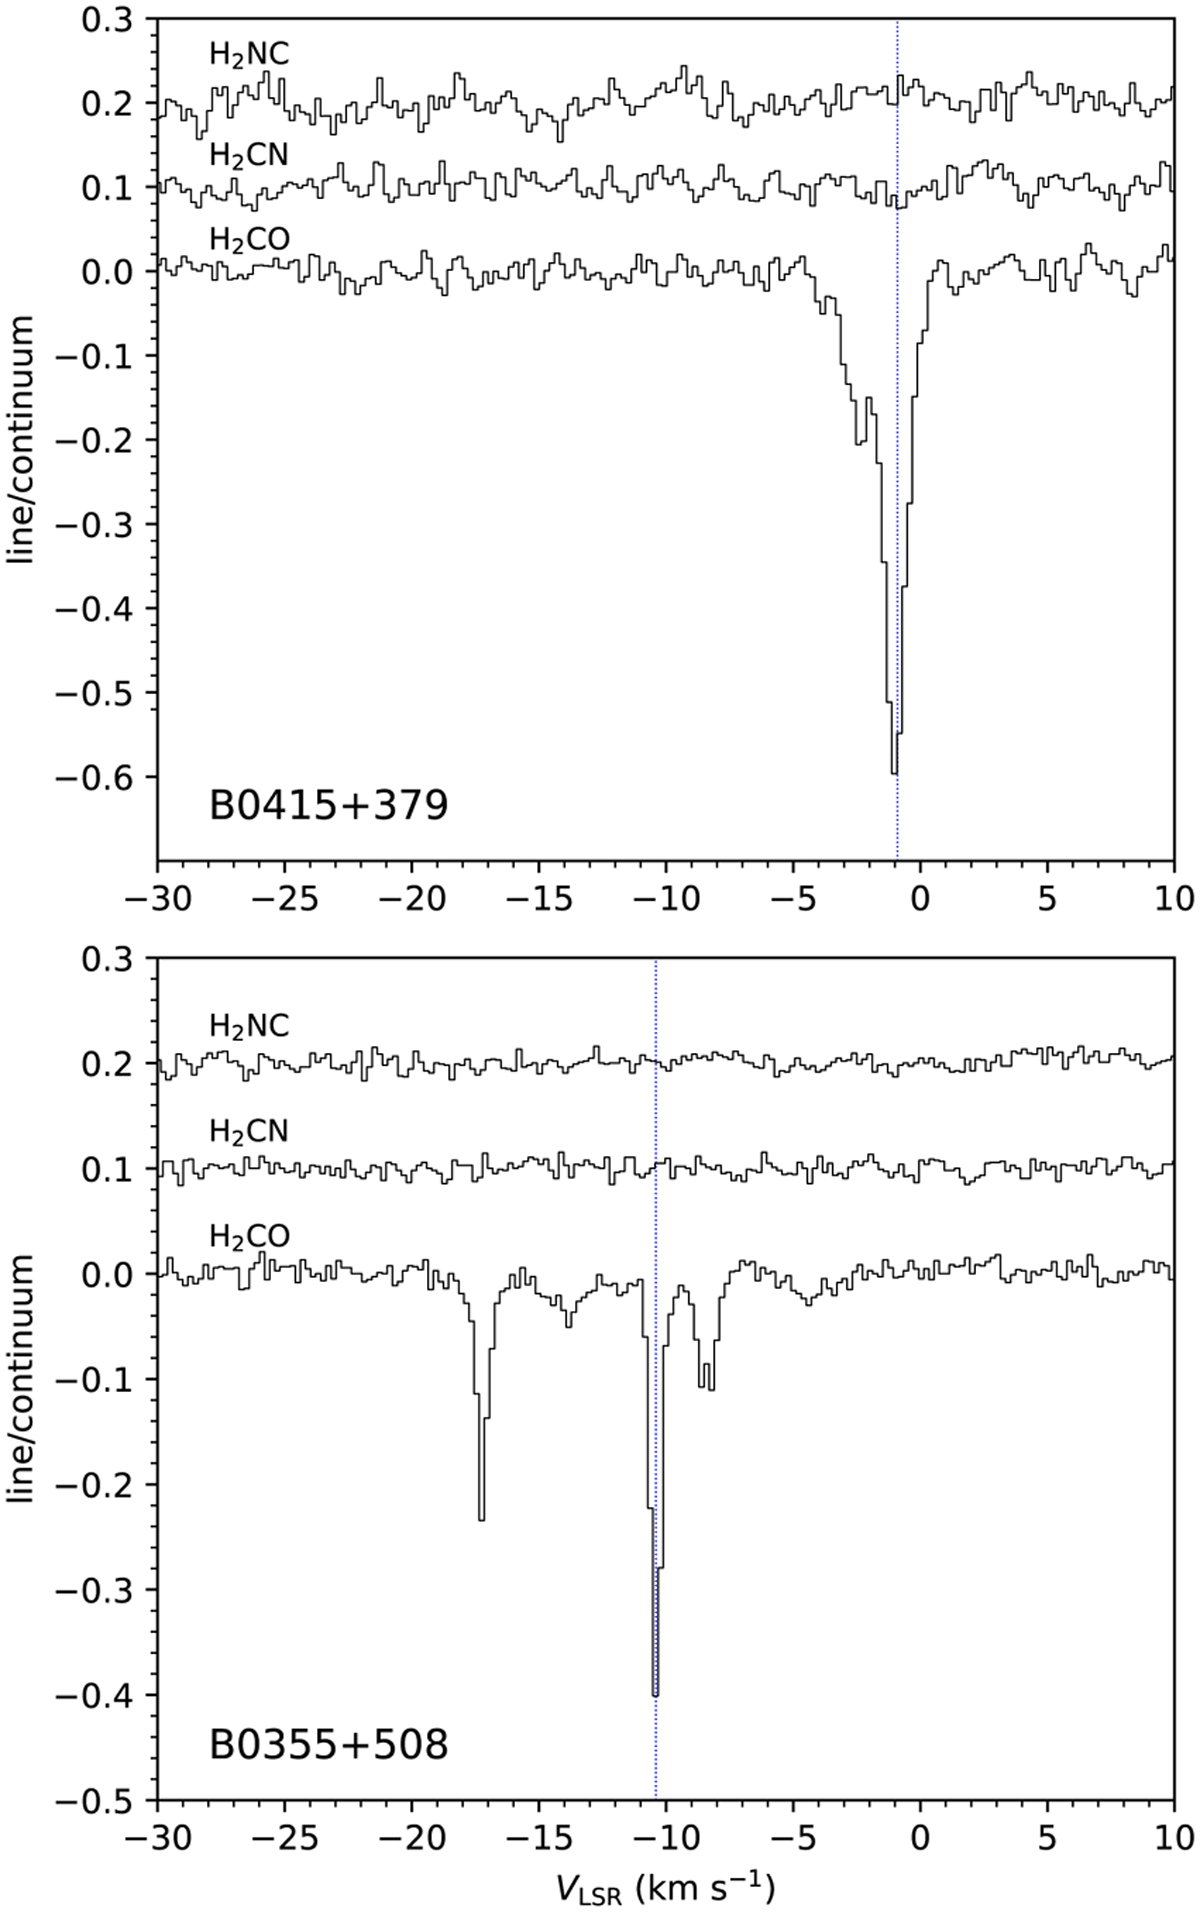
Spectra of B0415+379 and B0355+508 at the frequencies of H2CO 10,1–00,0 (72 837.949 MHz) and of the strongest hyperfine component of H2NC and H2CN (72194.211 MHz and 73 349.648 MHz, respectively). The y-axis is expressed as line/continuum. The position of the deepest absorption of H2CO, VLSR = −0.9 km s−1 in B0415+379 and VLSR = −10.4 km s−1 in B0355+508, is indicated by a vertical dotted blue line.
Current usage metrics show cumulative count of Article Views (full-text article views including HTML views, PDF and ePub downloads, according to the available data) and Abstracts Views on Vision4Press platform.
Data correspond to usage on the plateform after 2015. The current usage metrics is available 48-96 hours after online publication and is updated daily on week days.
Initial download of the metrics may take a while.