Fig. 1
Download original image
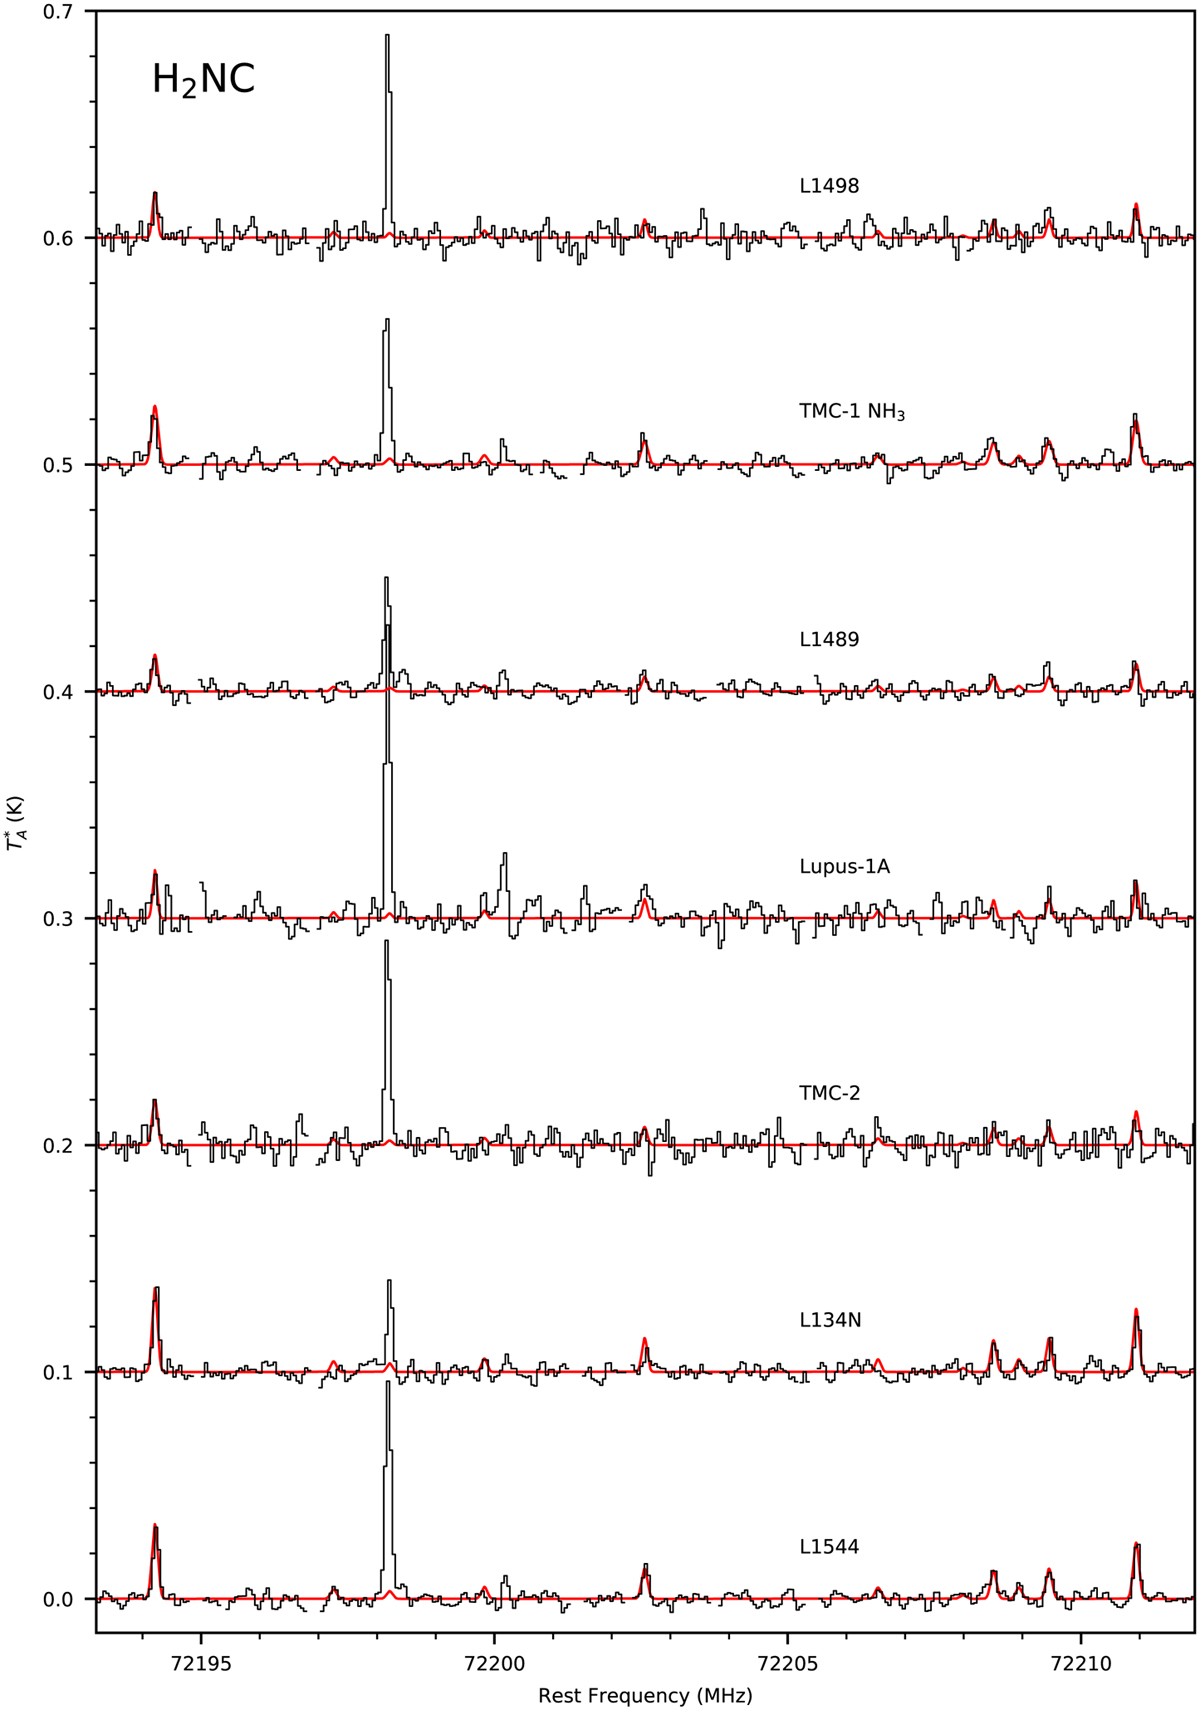
Spectra of L1544, L134N, TMC-2, Lupus-1A, L1489, TMC-1 NH3, and L1498 in the region covering the two most intense hyperfine components of the 10,1–00,0 transition of H2NC, at 72194.211 MHz and 72 210.940 MHz. In red we show the calculated synthetic spectra for H2NC, adopting the column densities given in Table 3, an ortho-to-para ratio of 3, a rotational temperature of 4.0 K, a line width consistent with the values derived from the observations (see Table 2), and an emission size that fills the IRAM 30 m main beam. The bright line around 72 198 MHz corresponds to C2D (see Cabezas et al. 2021).
Current usage metrics show cumulative count of Article Views (full-text article views including HTML views, PDF and ePub downloads, according to the available data) and Abstracts Views on Vision4Press platform.
Data correspond to usage on the plateform after 2015. The current usage metrics is available 48-96 hours after online publication and is updated daily on week days.
Initial download of the metrics may take a while.