Open Access
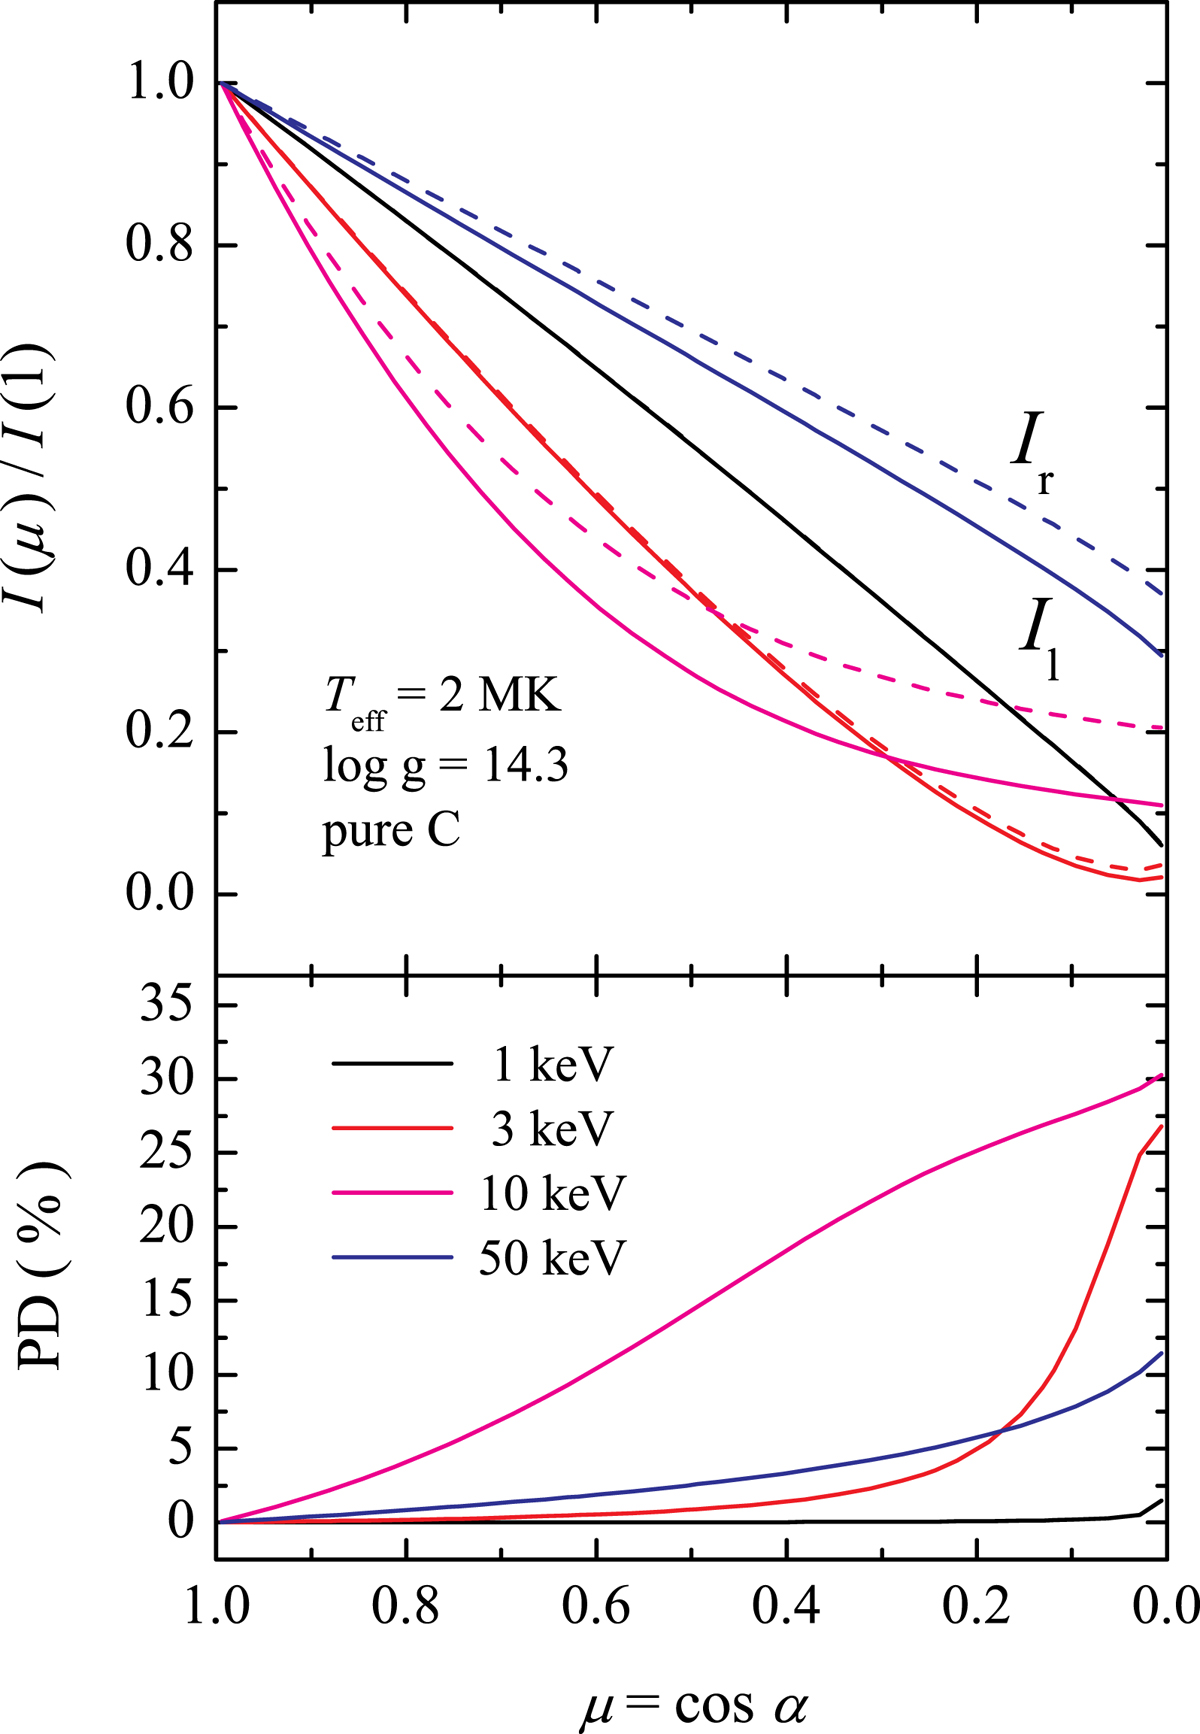
Fig. 7.
Download original image
Dependence of the specific intensities in two modes (top panel) and of the PD (bottom panel) on the angle to the normal for the same model atmosphere as in Fig. 6 for four photon energies, i.e., 1, 3, 10, and 50 keV, shown by black, red, magenta, and blue curves, respectively. Black solid and dashed curves coincide.
Current usage metrics show cumulative count of Article Views (full-text article views including HTML views, PDF and ePub downloads, according to the available data) and Abstracts Views on Vision4Press platform.
Data correspond to usage on the plateform after 2015. The current usage metrics is available 48-96 hours after online publication and is updated daily on week days.
Initial download of the metrics may take a while.