Fig. 16.
Download original image
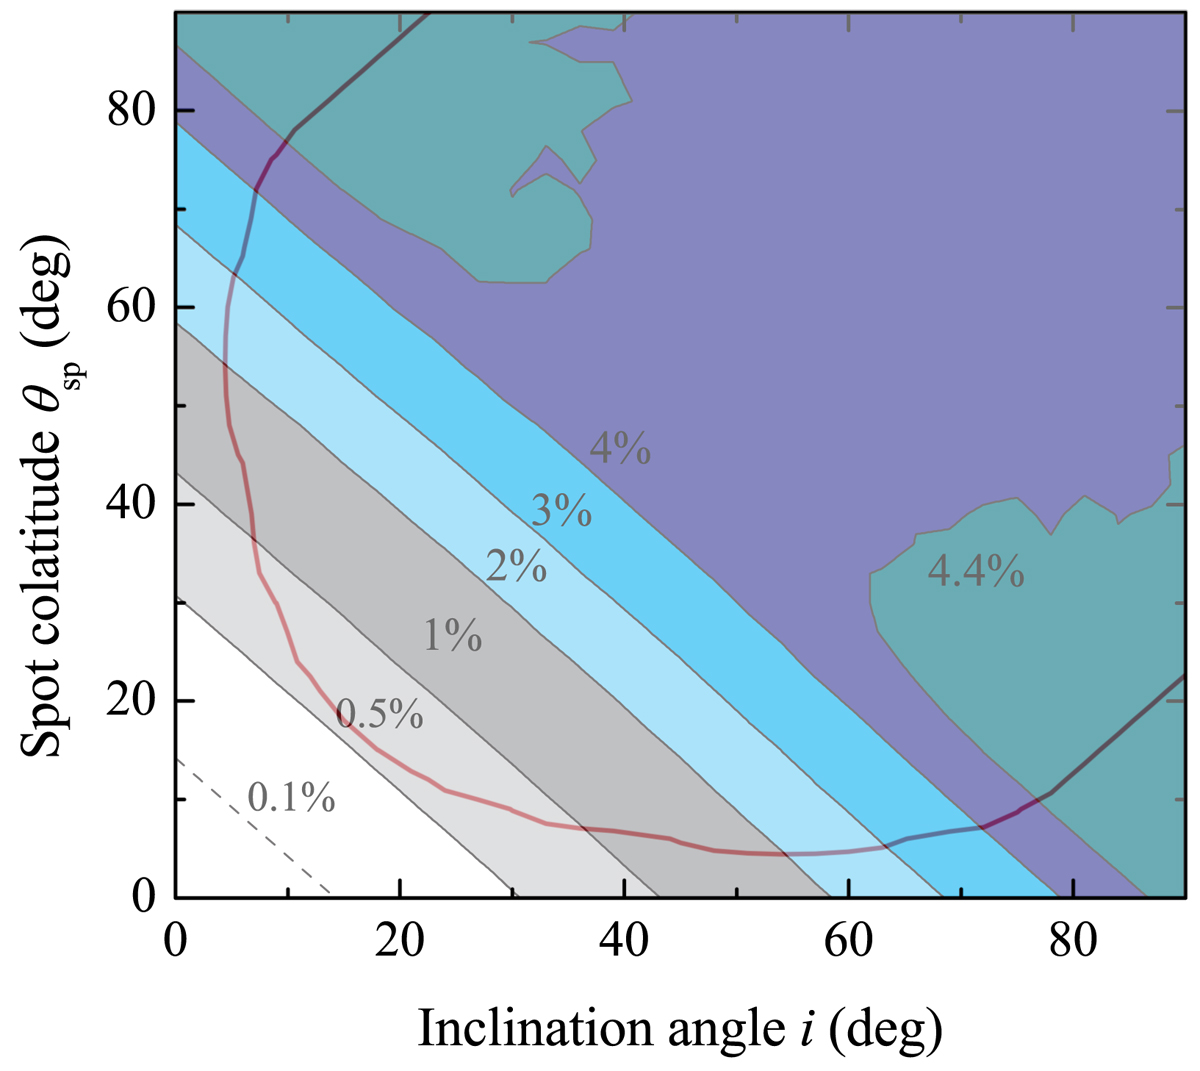
Map of the maximum PD in the 2–8 keV band, achievable at some rotational phases, depending on the inclination angle and the co-latitude of the spot center θsp computed for the model with the hydrogen spot hatm. The robust observational limit on the pulsed fraction of 9.7% is also shown with a thick red curve (see details in Doroshenko et al. 2022). The curves of equal PD are labeled.
Current usage metrics show cumulative count of Article Views (full-text article views including HTML views, PDF and ePub downloads, according to the available data) and Abstracts Views on Vision4Press platform.
Data correspond to usage on the plateform after 2015. The current usage metrics is available 48-96 hours after online publication and is updated daily on week days.
Initial download of the metrics may take a while.