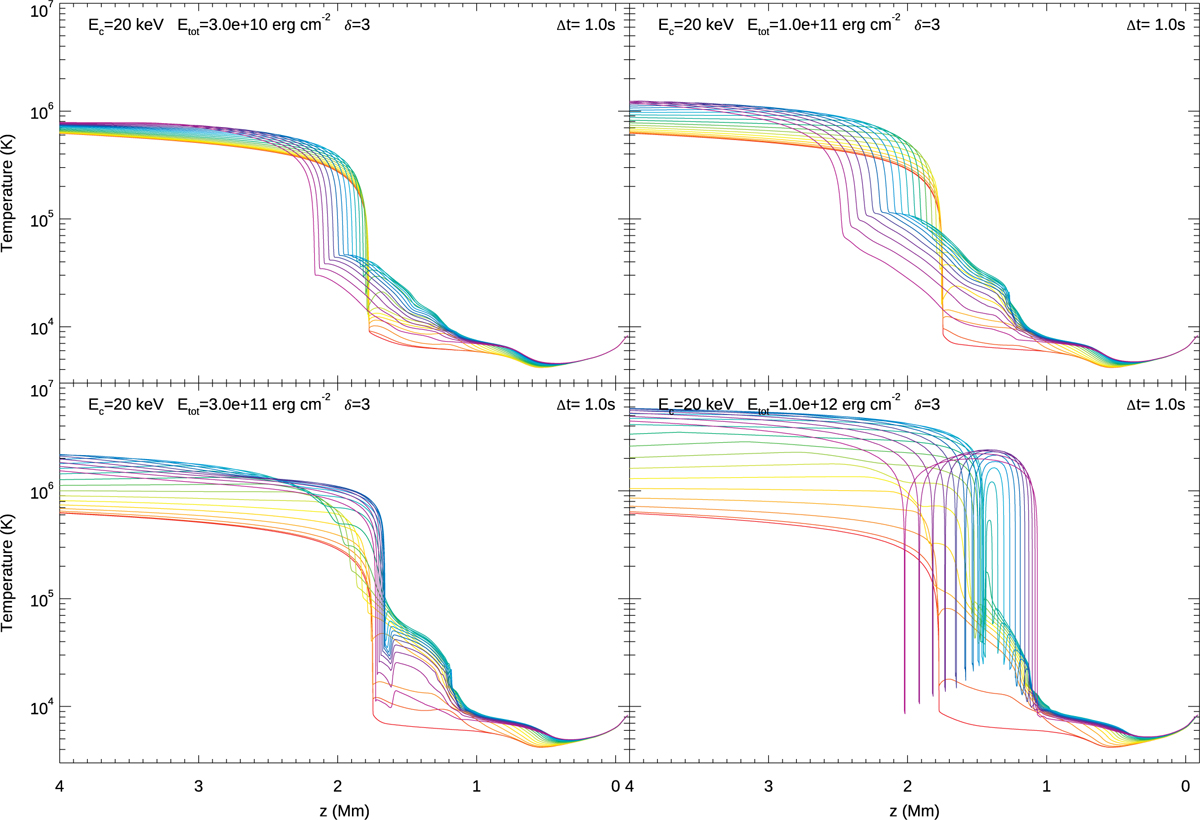
Fig. A.2
Download original image
Temperature as function of loop position, z, and time for the four different values of the total energy, a lower-energy cutoff of 20 keV, and a spectral index of 3. The initial temperature structure is shown in red, with subsequent timesteps, separated by 1.0s, shown with rainbow colours from red to violet. The last timestep shown is at t=20s, when the beam was switched off.
Current usage metrics show cumulative count of Article Views (full-text article views including HTML views, PDF and ePub downloads, according to the available data) and Abstracts Views on Vision4Press platform.
Data correspond to usage on the plateform after 2015. The current usage metrics is available 48-96 hours after online publication and is updated daily on week days.
Initial download of the metrics may take a while.