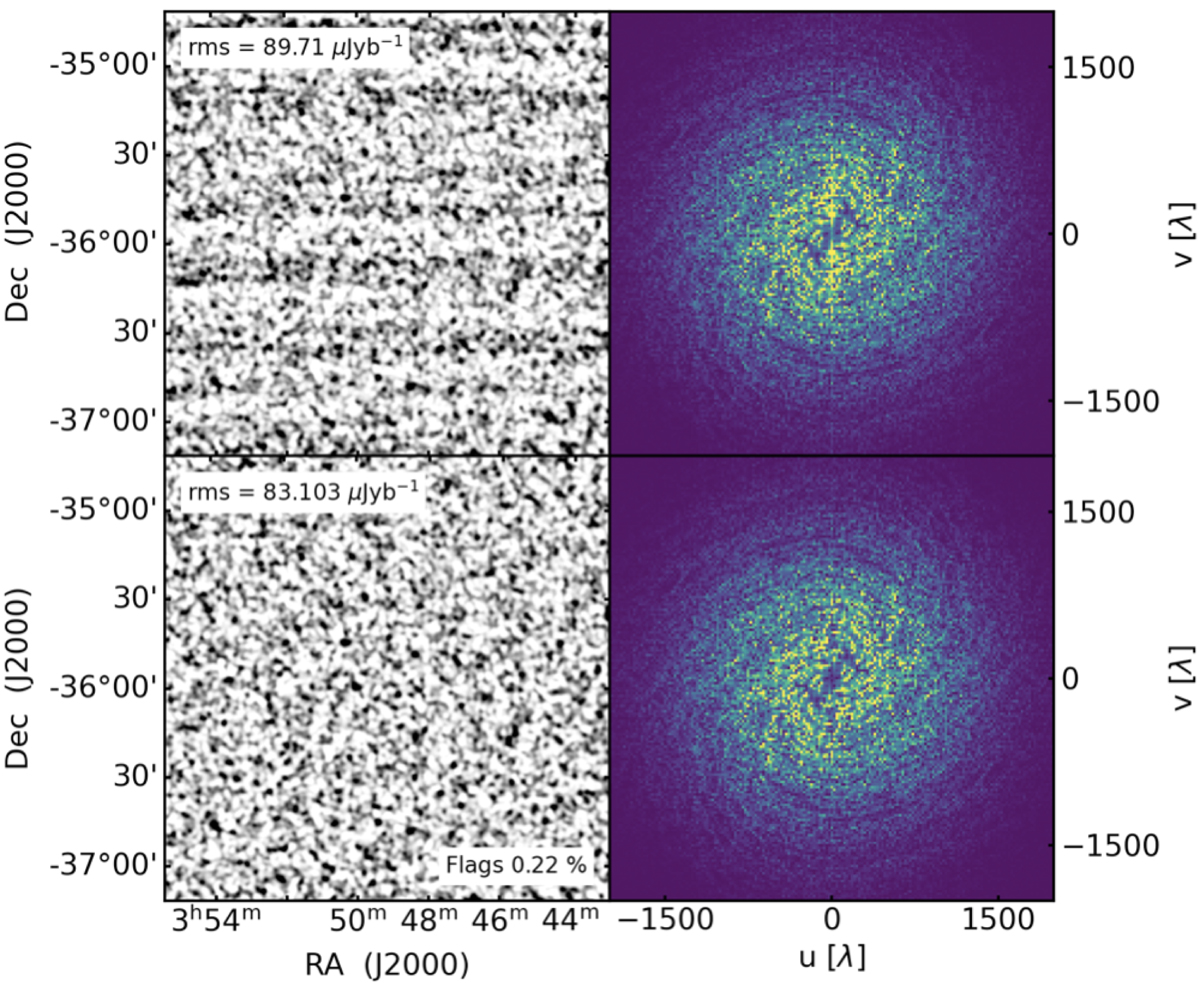
Fig. 6.

Download original image
H I data before (top) and after (bottom) flagging the broad-band RFI near u = 0 for a typical MeerKAT 5 h observation. The top row shows broad horizontal stripes in the image plane (left) and a corresponding bright vertical stripe at u = 0 in its Fourier transform (right). The bottom row shows that, in this case, by flagging just 0.22% of the data (as indicated in the bottom right corner of the left panel), the stripes are no longer visible and the formal noise of the image decreases by 8% (see the noise values reported in the top left corner of the left panels). After flagging, the bright vertical stripe is no longer visible in the Fourier transform of the image (bottom right panel). We note that this figure shows the image (and its Fourier transform) that is obtained by combining all science scans of a 5 h observation, whereas the flags are calculated for each scan independently (see Sect. 3.6).
Current usage metrics show cumulative count of Article Views (full-text article views including HTML views, PDF and ePub downloads, according to the available data) and Abstracts Views on Vision4Press platform.
Data correspond to usage on the plateform after 2015. The current usage metrics is available 48-96 hours after online publication and is updated daily on week days.
Initial download of the metrics may take a while.


