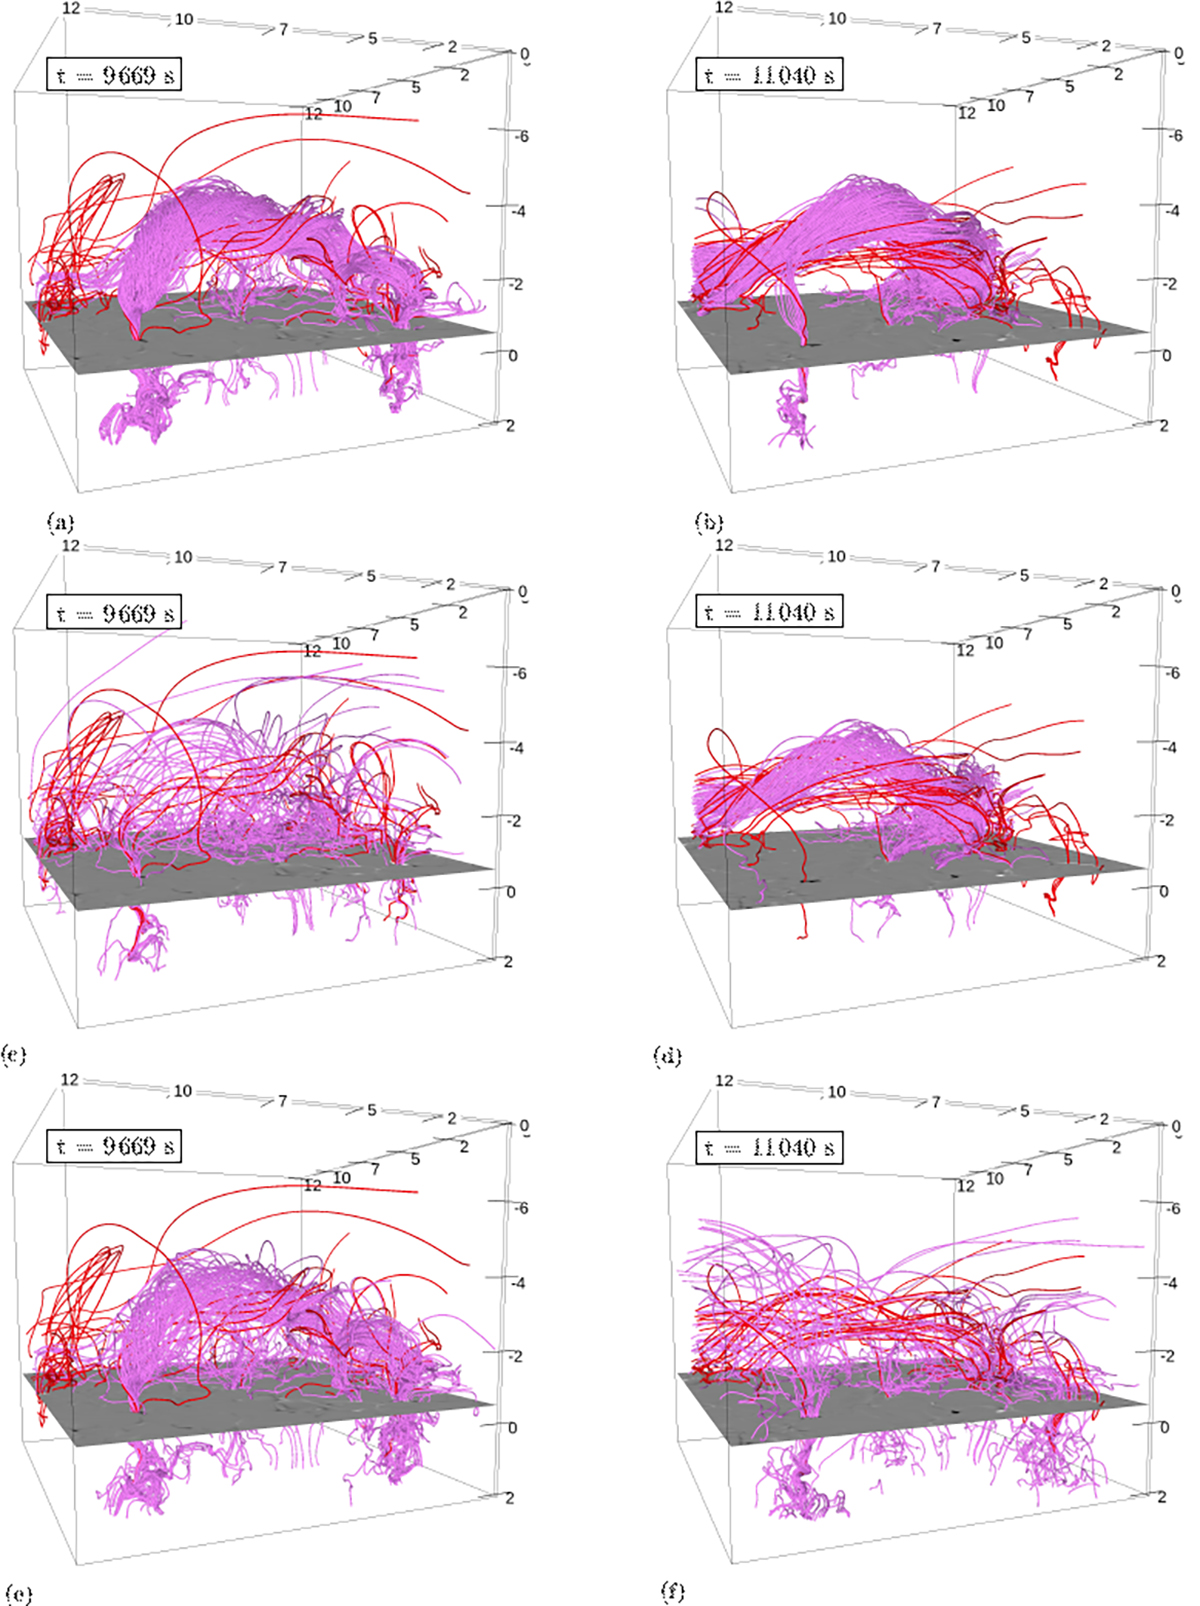
Fig. A.1.
Download original image
Upper panels illustrate a horizontal flux system seeded consistently in space at t = 9 669 s (left) and t = 11 040 s (right). Red lines are seeded with Lagrangian markers as reported in Robinson et al. (2022). Center panels illustrate the time evolution of a horizontal flux system seeded by Lagrangian markers at t = 11 040 s (right) and traced backward in time (left). Lower panels are the same as center panels, except seeded by Lagrangian markers beginning at t = 9 669 s (left) and traced forward in time (right).
Current usage metrics show cumulative count of Article Views (full-text article views including HTML views, PDF and ePub downloads, according to the available data) and Abstracts Views on Vision4Press platform.
Data correspond to usage on the plateform after 2015. The current usage metrics is available 48-96 hours after online publication and is updated daily on week days.
Initial download of the metrics may take a while.