Fig. 1.
Download original image
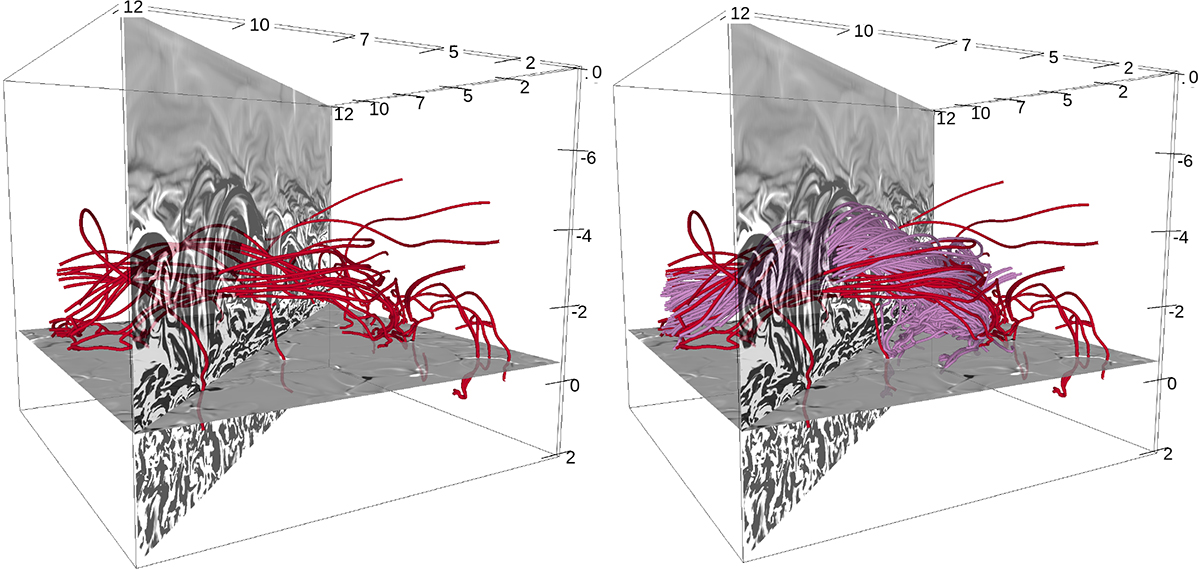
Magnetic field lines at t = 11 040 s belonging to a flux rope as analyzed in Robinson et al. (2022), with a bisecting plane colored by saturated α values (left). The right panel is the same as left panel, with the addition of lines corresponding to the wider flux rope that was first seeded by its proximity to the thin current sheets in the rope near the orthogonal slice, then seeded by corks that were geometrically closest to those lines at that time.
Current usage metrics show cumulative count of Article Views (full-text article views including HTML views, PDF and ePub downloads, according to the available data) and Abstracts Views on Vision4Press platform.
Data correspond to usage on the plateform after 2015. The current usage metrics is available 48-96 hours after online publication and is updated daily on week days.
Initial download of the metrics may take a while.