Fig. 7.
Download original image
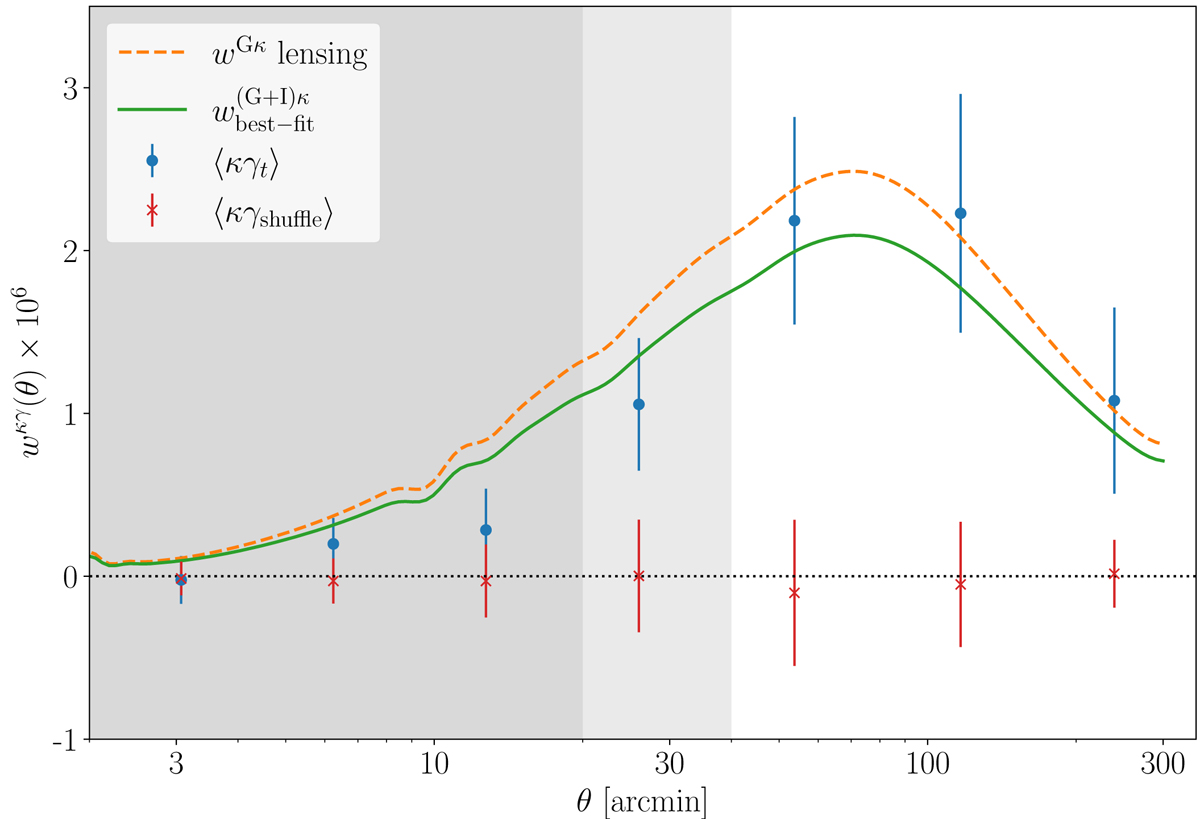
Measurement of the cross-correlation between Planck convergence κ and KiDS-1000 shear γ, based on Eq. (19). The blue dots are the measurements using tangential shear, with the green curve showing the best-fit considering both lensing and IA, while the orange curve shows only the lensing-lensing component. The red crosses show the null test by randomly shuffling the shear galaxies. The 45-deg rotation tests for both the blue dots and the red dots are consistent with 0. The differently shaded regions correspond to our angular scale cuts at 2, 20 (default), and 40 arcmin.
Current usage metrics show cumulative count of Article Views (full-text article views including HTML views, PDF and ePub downloads, according to the available data) and Abstracts Views on Vision4Press platform.
Data correspond to usage on the plateform after 2015. The current usage metrics is available 48-96 hours after online publication and is updated daily on week days.
Initial download of the metrics may take a while.