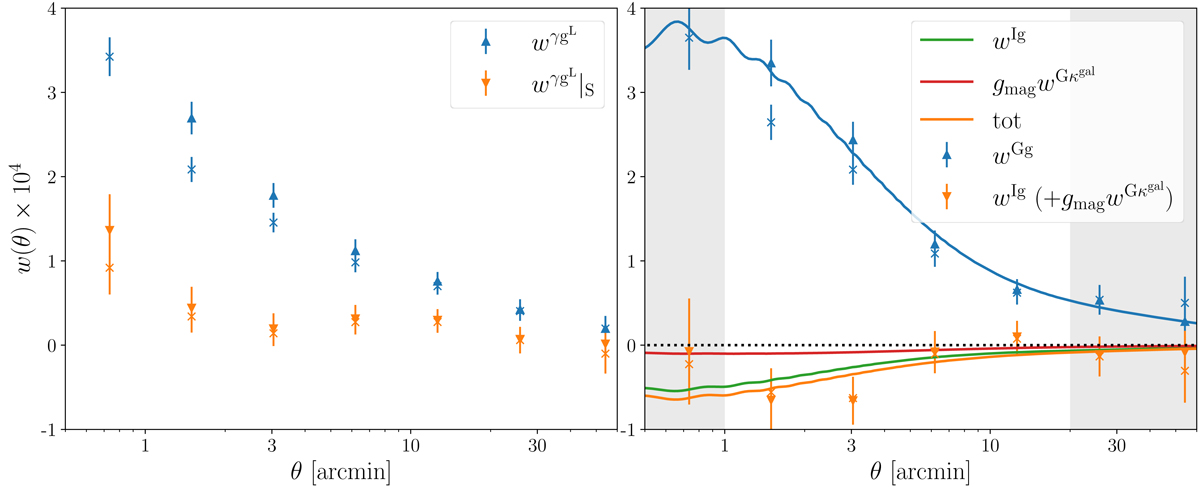
Fig. 6.
Download original image
Measurements of SC. Left panel shows the measurement of the two introduced observables wγgL and the one with the SC selection wγgL|S, while the corresponding 45-deg rotation test is consistent with 0 for both measurements. The significant separation of the two signals shows that SC is applicable. Right panel shows the separated lensing signal wGg and wIg (derived using Eqs. (15), (16), and Fig. 4), where the latter is contaminated by the magnification signal as shown in Eq. (16). The up- and down-triangles are the results that take the boost factor (Fig. 5) into consideration, while the crosses are the results that ignore this correction, setting B = 1. The curves are the theoretical value with the best-fit {AIA, bg, eff, gmag} of this work. The blue curve represents the separated lensing signal as in Eq. (17). Orange curve represents the total contribution of IA and magnification as in Eq. (18).
Current usage metrics show cumulative count of Article Views (full-text article views including HTML views, PDF and ePub downloads, according to the available data) and Abstracts Views on Vision4Press platform.
Data correspond to usage on the plateform after 2015. The current usage metrics is available 48-96 hours after online publication and is updated daily on week days.
Initial download of the metrics may take a while.